by Dave Senf
February 2020
Each issue of Minnesota Employment Review devotes two pages to updating 10 Minnesota economic indicators with a short summary of the monthly change for each indicator. The indicators are key stats that can be used to gauge the current economic climate and the prospects for future activity. The indicators are calculated monthly and are a mix of three indicator types: lagging, coincident, and leading.
Lagging indicators are sort of like looking into a rearview mirror while driving, providing information on where the economy has been. Coincident indicators provide valuable information clarifying the current state of the economy. Leading indicators change in advance of the rest of the economy, suggesting where the economy may be going before it goes there. Leading indicators are like your auto lights at night, highlighting what is up ahead. Indicators are all about identifying patterns in economic activity and catching shifts in the patterns.
Some of the indicators serve as proxies for economic forces that aren’t directly measured. Online help-wanted ads is one such proxy, serving as a measure of demand for workers. Initial claims for unemployment benefits is another proxy, indirectly measuring the layoff rate of workers.
Most of the indicators are based on surveys and in some cases subject to revisions as more complete information is reported. Some revisions occur the next month after the initial release and tend to be small. Other revisions are made nearly a year after the indicators were originally published. Some of these revisions can be major, resulting in a significant rewrite of how the economy has been performing or where it is headed.
The picture of the economy presented by some indicators in real-time (when released) may not be an accurate picture given the revisions. Keep that in mind when reviewing the indicator graphs presented here.
Half of the indicators have monthly data that go back to 1970 while the newest indicator, online help-wanted ads, has only been compiled and reported since 2005. All but four of the indicators are seasonally adjusted.
A short summary of each indicator is presented below to address the most common indicator-related questions that the Labor Market Information help-line (651-259-7384, 1-888-234-1114 or deed.lmi@state.mn.us) receives. Also presented are graphs for each indicator with recession periods highlighted.
Recession periods are highlighted in order to evaluate which if any of the indicators have a track record at correctly signaling turning points in the economy.1 A link to download a complete set of the indicators is now included in the Minnesota Economic Indicator section.
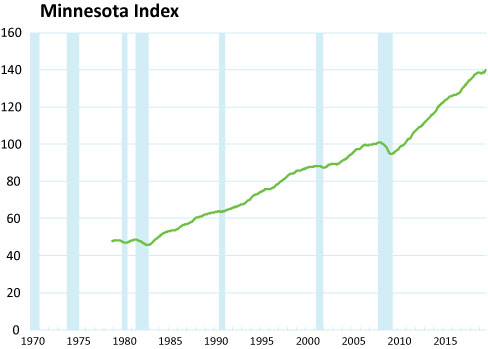
The Minnesota Index is one of 50 state-level coincident indices produced by the Philadelphia Federal Reserve Bank.2The state indices combine four state-level indicators (nonfarm payroll employment, average weekly manufacturing hours, the unemployment rate, and wage and inflation-adjusted wage and salary payments) into a single statistic. Since each state’s index is set to the trend of its gross domestic product (GDP), changes in the index are a proxy for GDP changes. This indicator is revised annually, and the revisions can be significant as three of the components (payroll employment, the unemployment rate, and wage and salary payments) are revised annually and those revisions can be significant.
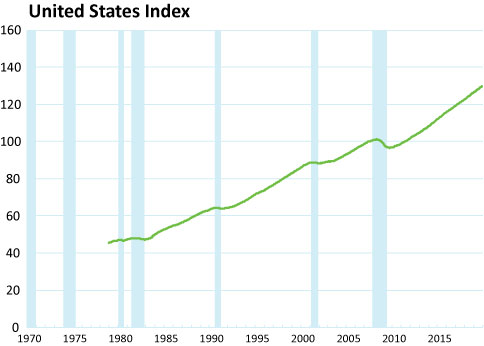
The U.S. Index uses the same four components as state level coincident indices. It is subject to smaller revisions since the surveys that generate payroll employment and the unemployment rate are designed to produce more reliable national estimates than state level estimates. Comparing the percentage changes in the U.S. index and state indices is a handy way to gauge how state economies are doing relative to the nation.
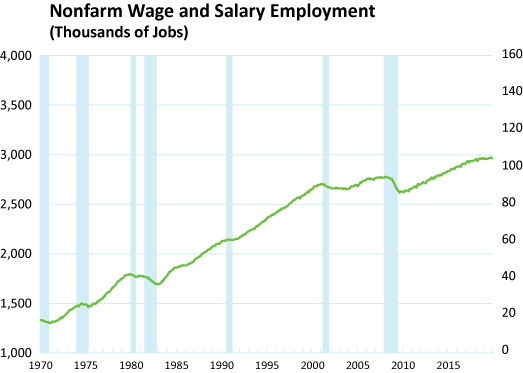
Minnesota’s seasonally adjusted Nonfarm Wage and Salary Employment is one of the components included in the Minnesota Index. It is collected via the Current Employment Statistics (CES) survey and does not include self-employ or farm employment. This indicator is benchmarked to Quarterly Census of Employment and Wage (QCEW) data in March of the following year. QCEW numbers are based on unemployment insurance records.
Most years benchmarking results in only minor revisions, but there are years when larger revisions occur. Last year benchmarking scaled back initial estimates of 2018 job growth from 1.1 to 0.7 percent. Benchmarking this year is expected to boost the current estimate of 2019 job growth of 0.3 to 0.5 percent. As a result, the Minnesota Index will show a slightly higher growth for 2019 than is currently being reported.
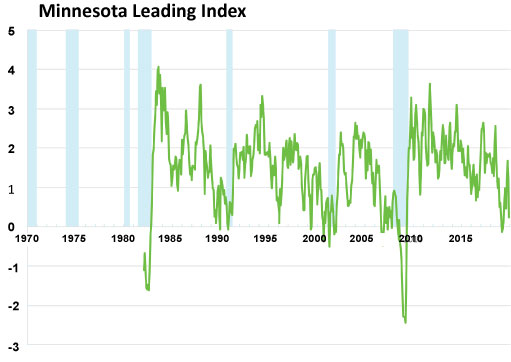
Minnesota Leading Index, as the name implies, is one of the leading indicators updated monthly. It is also produced by the Philadelphia Federal Reserve Bank.3The index is designed to predict the six-month growth rate of the Minnesota Index which, as discussed above, is a proxy for GDP growth. The leading index includes the Minnesota Index as well as four other indicators including two other indicators covered in the Minnesota Economic Indicators section: Minnesota home-building permits (1 to 4 units) and initial unemployment insurance claims. The leading index tends to undergo major revisions regularly so its predictive power in real-time is tentative.
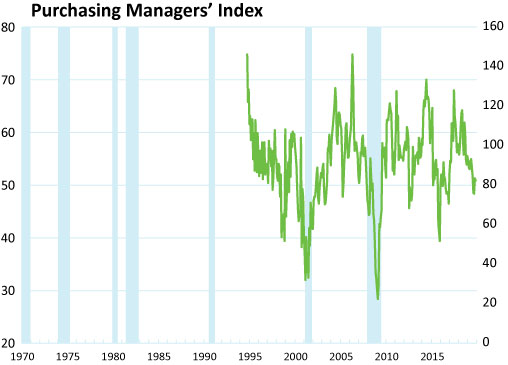
The Purchasing Mangers’ Index is borrowed from Creighton University analysts who each month survey purchasing managers across a nine-state region from Minnesota to Arkansas. PMI indices are generated for each state as well as a Mid-American Business Conditions Index encompassing all nine states.4A PMI index above 50 suggests expanding manufacturing activity over the next three to six months while a reading below 50 points towards contraction in manufacturing output. This index is not subject to revisions.
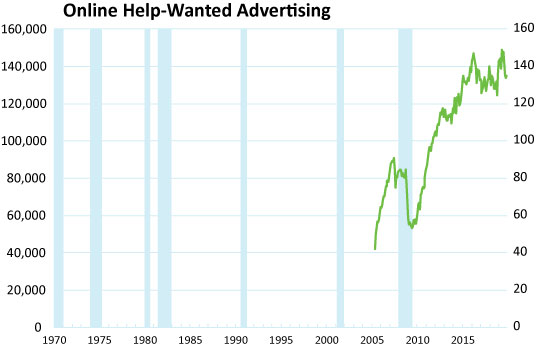
Online Help-Wanted Ads have been compiled and published for every state by the Conference Board since 2005. Online help-wanted postings are used as an indirect measure of job vacancies or unmet labor demand. Other factors, especially the cost of listing online job ads, are unrelated to overall labor demand and have altered help-wanted levels over the last 14 years. The drop in Minnesota’s online help-wanted ads between 2016 and 2018 is thought to be related to higher job ad listing costs at one major job board.
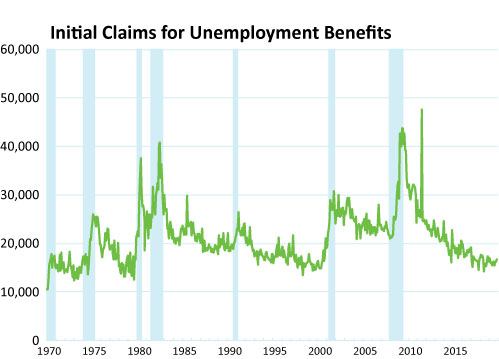
Initial Claims for Unemployment Benefits (UI) is a well-known leading indicator of labor market conditions and thought to be a good proxy for job layoff rates. There are two issues that should be consider when looking at initial claims. One is that the labor force today is much larger than two or three decades ago. The same level of initial claims three decades ago represented a much larger share of workers than today. The other issue is that rules for UI eligibility have been changed over the years which altered the relationship between layoff rates and initial claims.
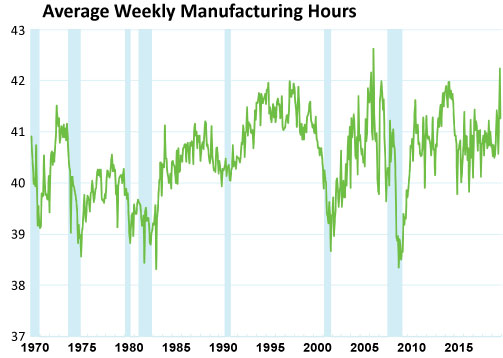
Average Weekly Manufacturing Hours is another indicator that is derived from the CES survey and is seasonally adjusted. Minor revisions occur to this indicator one month after initial release. This indicator is also seen as a measure of labor demand with increasing or decreasing hours indicating that manufacturing production is expanding or slowing down. Firms typically adjust their workers’ hours before hiring or laying off workers. A shifting mix of manufacturing industries over time may alter the sensitivity of manufacturing hours to business cycles.
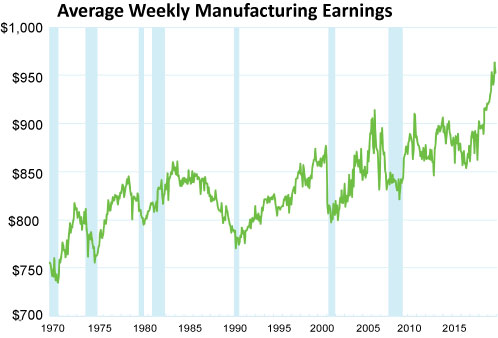
Average Weekly Manufacturing Earnings also come from the CES survey and, like manufacturing hours, undergoes small revisions the month following initial release. In addition to being seasonally adjusted, manufacturing earnings are adjusted to account for inflation using the Personal Consumption Expenditures (PCE) index produced by the Bureau of Economic Analysis. Earnings are for production workers only. Earnings are also often used to gauge labor demand. The recent runup in average weekly manufacturing earnings is strong evidence that firms are having a hard time filling their job vacancies and have started to increase wage rates. Manufacturing earnings usually climb as hours worked increase but may in extremely tight job markets increase even while manufacturing activity is tailing off.
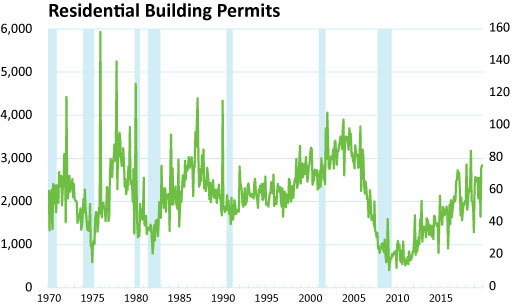
Residential Building Permits are collected by the Census, are not revised, and are seasonally adjusted. Home-building permits, like four of the other Minnesota Economic Indicators, are included at the national level in the Conference Board’s Composite Index of Leading Economic Indicators. Home-building activity has in the past been one of the first economic sectors to expand or contract when economic conditions improve or weaken. This has not held true over the last decade as the home-building rebound over the last decade or so has been very slow and uneven. The underlying trend for building permits is probably best determined by using a three-month average as month-to-month variation can swing wildly when normal weather patterns are disrupted.
1The indicator charts are updated monthly and available electronically