
by Mark Schultz and Tim O'Neill
September 2021
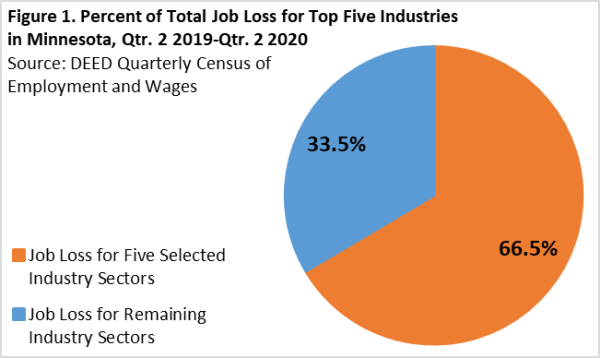 The bulk of the jobs lost over the year between the second quarter of 2019 and the second quarter of 2020 were concentrated in just five industry sectors: Accommodation & Food Services, Retail Trade, Health Care & Social Assistance, Other Services, and Arts, Entertainment & Recreation. By far the largest numeric loss in jobs was experienced by Accommodation & Food Services, which saw a job decline to the tune of over 105,000 jobs, down 44.1%. This industry alone accounted for almost 30% of the statewide job lost during this one-year period. This significant loss was followed by a drop of over 40,000 jobs in Retail Trade (-13.7%), over 34,000 jobs in Health Care & Social Assistance (-6.8%), nearly 30,000 jobs in Other Services (-32.6%) and over 29,000 jobs in Arts, Entertainment & Recreation (-52.7%) (Table 1). Overall, these five industry sectors accounted for 66.5% of the jobs lost in the state (Figure 1).
Table 1. Top 5 Industry Sectors that Lost the Most Jobs in Minnesota (2nd Quarter 2019 - 2020)
| Industry Sector | 2nd Qtr. 2019 Jobs | 2nd Qtr. 2020 Jobs | 2019-2020 | |
|---|---|---|---|---|
| Numeric Change | Percent Change | |||
| Total, All Industries | 2,919,269 | 2,560,007 | -359,262 | -12.3% |
| Accommodation & Food Services | 238,563 | 133,357 | -105,206 | -44.1% |
| Retail Trade | 292,774 | 252,594 | -40,180 | -13.7% |
| Health Care & Social Assistance | 500,027 | 465,922 | -34,105 | -6.8% |
| Other Services (except Public Administration) | 92,102 | 62,105 | -29,997 | -32.6% |
| Arts, Entertainment, & Recreation | 55,519 | 26,277 | -29,242 | -52.7% |
| Source: DEED Quarterly Census of Employment and Wages | ||||
Measures to control the spread of the coronavirus and save lives during the early months of the pandemic caused many businesses to close their doors (temporarily or permanently), reduce their hours of operation, and reduce their workforce. As a result, the state experienced an unprecedented loss of 359,262 jobs over the year from second quarter 2019 to second quarter 2020, a drop of 12.3%. While things are getting back to normal and businesses have been reopening and welcoming back their employees, the state still has a way to go to gain back all the jobs lost during this turbulent time.
Not surprisingly, all six individual planning regions throughout the state experienced job loss to varying degrees from second quarter 2019 to 2020. The largest numeric decrease in jobs was in the Metro region, which lost nearly 234,000 jobs, a decrease of 13.1%. However, at 15.2% Northeast Minnesota saw the sharpest drop, a decline of almost 22,100 jobs (Table 2).
Table 2. Job Loss by Planning Region (2nd Qtr. 2019 - 2020)
| Planning Region | 2nd Qtr. 2019 Jobs | 2nd Qtr. 2020 Jobs | 2019 - 2020 | |
|---|---|---|---|---|
| Numeric Change | Percent Change | |||
| Central | 281,221 | 251,185 | -30,036 | -10.7% |
| Northeast | 145,575 | 123,497 | -22,078 | -15.2% |
| Northwest | 226,744 | 201,395 | -25,379 | -11.2% |
| Southeast | 247,738 | 221,154 | -26,584 | -10.7% |
| Southwest | 177,971 | 160,479 | -17,492 | -9.8% |
| Metro | 1,783,447 | 1,549,670 | -233,777 | -13.1% |
| Source: DEED Quarterly Census of Employment and Wages | ||||
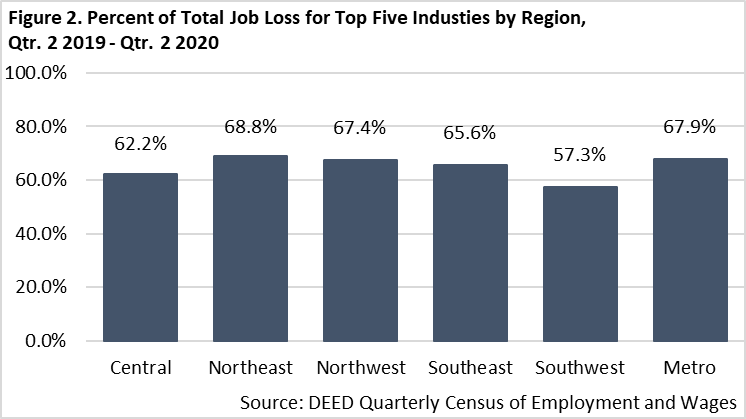
The Accommodation & Food Services industry experienced the largest loss of jobs in each of the six planning regions in the state, accounting for anywhere from 25.1% (Southwest) to 35.4% (Northwest) of the total job loss over the year. In addition, the percentage loss of jobs experienced by each region, using the sum of the five industry sectors mentioned above, ranged from a low of 57.3% in Southwest Minnesota to a high of 68.8% in Northeast Minnesota (Figure 2).
Evidence of just how hard these industry sectors were hit can also be seen by analyzing weekly Unemployment Insurance continued claims across these top five industries compared to the total of continued claims across all industries. From the start to the peak date the number of continued claims across all industries rose by 541.6%. While quite a hefty increase, it pales in comparison to the percent increases seen in the top five industry sectors. Leading the way was Accommodation & Food Services, which saw a staggering increase of 3,385.1%, jumping from 2,177 claims during the start week to almost 76,000 claims in the peak week. The remaining four industry sectors also saw mammoth percentage increases in continued claims, including an increase of 2,792.3% in Health Care & Social Assistance, 1,754.5% in Other Services, 1,609.2% in Retail Trade, and 1,448.6% in Arts, Entertainment & Recreation (Table 3).
Table 3. Weekly Continued Unemployment Insurance Claims by Selected Industry Sectors - Start to Peak Dates
| Industry | Start Date | Start Count | Peak Date | Peak Count | Numeric Change | Percent Change |
|---|---|---|---|---|---|---|
| Total Claims | 1/11/2020 | 63,214 | 5/2/2020 | 405,550 | 342,336 | 541.6% |
| Accommodation and Food Services | 1/11/2020 | 2,177 | 5/2/2020 | 75,871 | 73,694 | 3385.1% |
| Retail Trade | 1/11/2020 | 2,997 | 4/25/2020 | 51,225 | 48,228 | 1609.2% |
| Health Care and Social Assistance | 1/11/2020 | 2,415 | 5/9/2020 | 69,850 | 67,435 | 2792.3% |
| Other Services (except Public Administration) | 1/11/2020 | 1,422 | 4/18/2020 | 26,371 | 24,949 | 1754.5% |
| Arts, Entertainment, and Recreation | 1/11/2020 | 1,087 | 4/18/2020 | 16,833 | 15,746 | 1448.6% |
| Source: DEED PROMIS Data | ||||||
In addition to job loss and drastic increases in the number of workers claiming weekly unemployment benefits, the number of job openings took quite a hit from second quarter 2019 to 2020. According to DEED's Job Vacancy Survey the state saw a decrease of 34,760 openings, or a drop of 23.7%, during this time. Still, employers continued to scramble to find workers to fill their job openings. Not all the five industry sectors that experienced the largest job losses also experienced the highest drop in job vacancies. The largest vacancy losses were in Accommodation & Food Services (-9,548 or -38.7%), Manufacturing (-7,853 or -70.6%), Health Care & Social Assistance (-4,172 or -14.8%), Agriculture, Forestry, Fishing & Hunting (-2,989 or -91.6%), Professional & Technical Services (-2,582 or -38.3%) and Transportation & Warehousing (-2,578 or -52.1%) (Figure 3). Alone, these six industry sectors accounted for over four-fifths (85.5%) of the total vacancies lost during this one-year time frame.
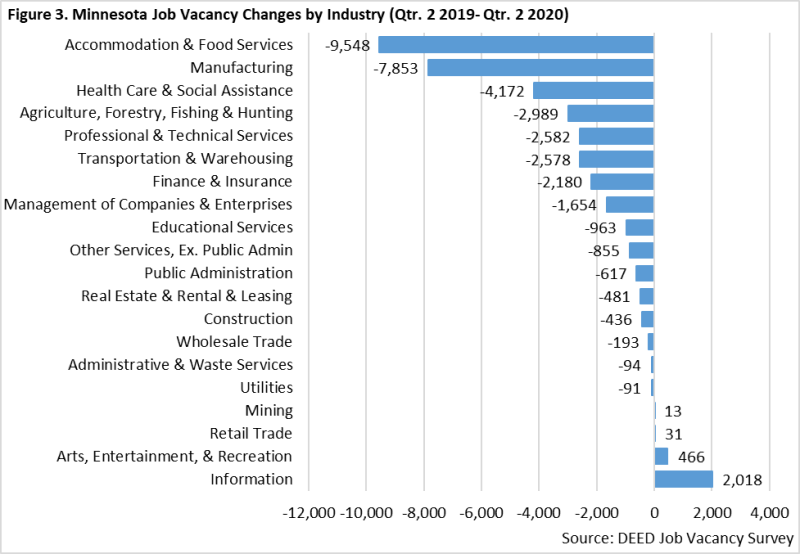
However, not every industry sector saw a pandemic-related decline in job vacancies. In fact, two of the top five industries that lost the most jobs actually saw a gain in the number of vacancies, including 466 vacancies in Arts, Entertainment & Recreation and 31 vacancies in Retail Trade. The remaining three, however, saw losses. Together, the five industry sectors that lost the most jobs experienced a net loss of 14,078 vacancies or 40.5% of all the total vacancies lost during this time.
Even with fewer vacancies during second quarter of 2020 compared to the same quarter a year prior, employers still experienced challenges when it came to hiring workers to fill their existing vacancies. Despite the drastic increase in the number of unemployed individuals due to the pandemic and subsequent layoffs and work hour reductions, many of those who found themselves unemployed were not in the market for work for a variety of reasons, such as waiting to be called back by their employer, lack of available child care, concerns for health and safety and having children in at-home schooling.
The COVID-19 pandemic severely impacted Minnesota's economy and labor market, resulting in significant employment losses, shifts in job vacancies, and unprecedented increases in claims for Unemployment Insurance. As previously mentioned, these impacts were concentrated in several industry sectors: Accommodation & Food Services; Retail Trade; Health Care & Social Assistance; Other Services; and Arts, Entertainment, & Recreation. To get a more complete picture for how these industries, as well as others, were hit by COVID-19, we now turn to impacts by demographic group. More specifically, we will highlight how employment by gender, race and ethnicity, as well as age were affected in Minnesota between 2019 and 2020.
For this demographic analysis, we use the U.S. Census Bureau's Quarterly Workforce Indicators (QWI) data. The QWI tool combines data from the Quarterly Census of Employment and Wages and various demographic sources, including the American Community Survey, Social Security administrative records, and individual tax returns. For our demographic analysis, we use beginning of quarter employment. This snapshot of annual QWI trends reveals the most significant employment loss in Minnesota between the third quarters of 2019 and 2020.
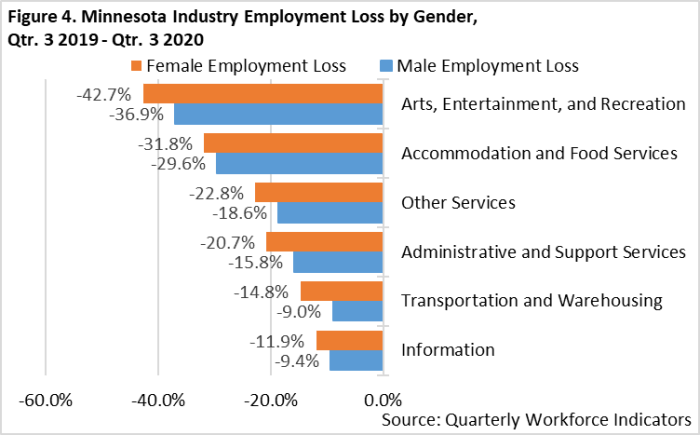 According to QWI data, Minnesota's total employment plummeted by 9.4% between third quarter 2019 and 2020, equivalent to more than 276,700 jobs. Over that period, women saw more job loss than men. Specifically, female employment declined by 10.3% while male employment declined by 8.5%. Numerically, female workers accounted for an estimated 55.0% of the state's total employment losses while male workers accounted for the remaining 45.0%. Figure 4 displays percent employment losses by gender for those hardest-hit industries overall between third quarter 2019 and 2020. As can be seen, such losses were more significant for female workers in each sector.
When analyzing industry share of employment loss by gender, Healthcare & Social Assistance was the hardest hit for women workers. Where women accounted for 55.0% of Minnesota's total employment losses between third quarter 2019 and 2020, they accounted for 87.8% of employment loss in Health Care & Social Assistance during that period. Similarly, women accounted for significant shares of employment loss in Finance & Insurance (83.3%), Retail Trade (67.7%), Other Services (62.0%), Educational Services (61.7%), Accommodation & Food Services (56.9%) and Real Estate and Rental & Leasing (56.1%).
Losses were significantly more severe for male workers than their female counterparts in Agriculture, Construction, Management of Companies, Educational Services, and Utilities. Overall, however, each of these industries witnessed much smaller job losses during the COVID-19 recession than those hardest-hit industries previously mentioned.
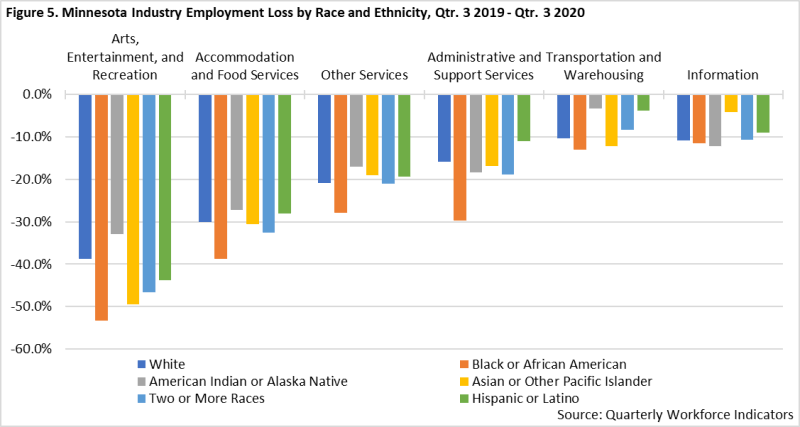
Stark differences in employment losses during the COVID-19 recession also appear when breaking the QWI trends down by race and ethnicity. Between third quarter 2019 and 2020, where total employment across all industries fell by 9.4%, it fell by 13.1% for American Indian or Alaska Native workers, 11.9% for workers of two or more races, and 11.7% for Black or African American workers. Losses were less severe overall for Asian or other Pacific Islander workers, down by7.5%, Hispanic or Latino workers down by 8.0%, and white workers down by 9.3% during that period.
The major industry sectors with higher shares of Black, Indigenous and People of Color (BIPOC) workers include Administrative & Support Services, Health Care & Social Assistance, Accommodation & Food Services, Manufacturing and Transportation & Warehousing. Each of these major sectors did lose a significant number of jobs and/or a significant share of their respective total employment between third quarter 2019 and 2020. Employment losses were also especially sharp for BIPOC workers in Arts, Entertainment & Recreation, despite that industry having a lower share of BIPOC workers. In that industry, employment dropped for Black or African American workers by 53.2%, for Asian or other Pacific Islander workers by 49.4%, for those workers reporting two or more races by 46.6%, and for Hispanic or Latino workers by 43.7%. For reference, total employment in the industry dropped by 39.8%. Employment losses specifically for Black or African American workers were also more significant in Accommodation & Food Services, Administrative & Support Services and Other Services, all hard-hit industries during the COVID-19 recession (Figure 5).
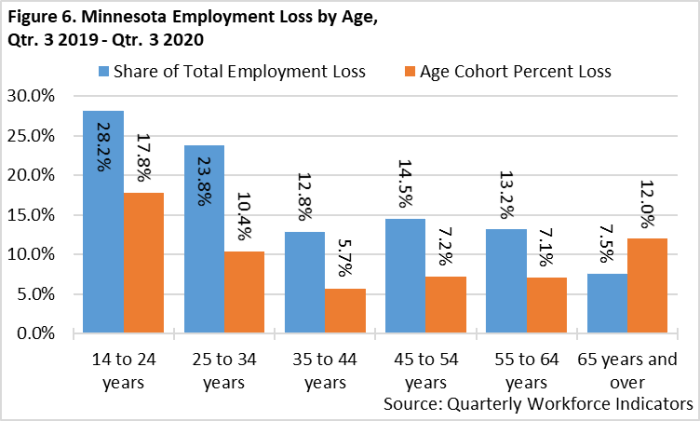 Lastly, when analyzing Minnesota's employment losses by age during the COVID-19 recession, further disparities begin to appear. These disparities are strongest for those workers at either end of the age spectrum. For example, where workers age 14 to 24 made up an estimated 14.9% of Minnesota's total employment during the third quarter of 2019, these workers accounted for 28.2% of the state's employment losses between third quarter 2019 and 2020. From a different point of analysis, where total employment in the state dropped by 9.4% between third quarter 2019 and 2020, total employment for workers ages 14 to 24 dropped by 17.8% (Figure 6).
While not impacted as severely as their younger counterparts, workers age 25 to 34 were also affected disproportionately by job loss. This group made up 21.5% of Minnesota's total employment during the third quarter of 2019, but accounted for 23.8% of the state's total employment losses through the following year. This age cohort's respective employment loss of 10.4% during that period was slightly higher than losses for the total across all ages (9.4%). For younger workers, especially those between 14 and 24 years, a much higher share are employed in the industries hardest-hit by COVID-19. For example, where workers 14 to 24 years made up approximately 14.9% of Minnesota's total employment during the third quarter of 2019, they made up about 37.3% of employment in Accommodation & Food Services and about 30.4% of employment in Arts, Entertainment, & Recreation. The two hardest-hit industries during COVID-19. Such workers also made up significant shares of total employment in Other Services (18.1%) and Administrative & Support Services (16.3%) before COVID-19 struck.
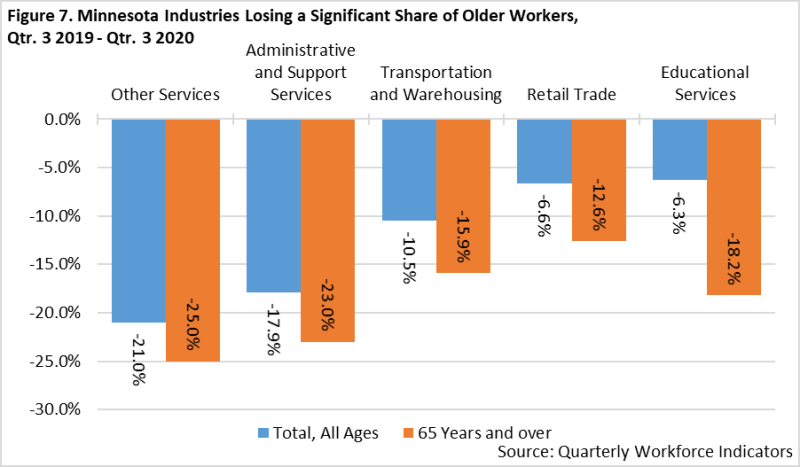
At the other end of the age spectrum, while workers age 65 and older made up a relatively smaller share of Minnesota's total employment losses during the COVID-19 recession (7.5%), the age cohort did experience more significant respective loss (12.0%). By industry, employment losses for these workers were more significant in Educational Services, Retail Trade, Transportation & Warehousing, Administrative & Support Services, and Other Services (Figure 7). Accommodation & Food Services; Arts, Entertainment, & Recreation; and Health Care & Social Assistance each lost a high number of workers age 65 and older during this period, but the percentage loss of older workers in these industries was similar to that for the total for all ages.
Nearly all industry sectors experienced employment loss between pre-pandemic peaks in 2019 and lows in the spring and summer months of 2020. Select industries, however, were especially hard-hit. By numeric employment loss, these include: Accommodation & Food Services; Retail Trade; Health Care & Social Assistance; Other Services; and Arts, Entertainment & Recreation. QWI data allows us to further understand how industries' labor force make up varied by demographics. In many cases, employment disparities already present were exacerbated by the COVID-19 recession, as seen with significant differences in employment loss by gender, race and ethnicity and age among the hardest-hit industries.