by Amanda Rohrer
December 2017
Women are less likely than men to be top wage earners in their fields in Minnesota, even in industries where women generally do well.
We know that women earn less than men in Minnesota and nationally. But how does this play out at the very top of organizations? Can women break through the glass ceiling to take the highest-paying jobs in Minnesota?
This analysis looks for outlier earners by industry in Minnesota to identify if women can make it to top earner status within their chosen field. To answer the question, the analysis uses newly available data from DEED and the Department of Public Safety. They are sharing some limited data, allowing the matching of age and gender from driver's license records with records of hours, earnings and industry from wage records as reported to the Unemployment Insurance Program.
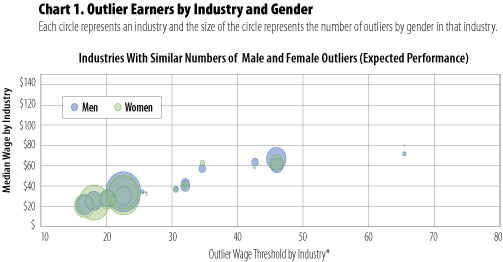
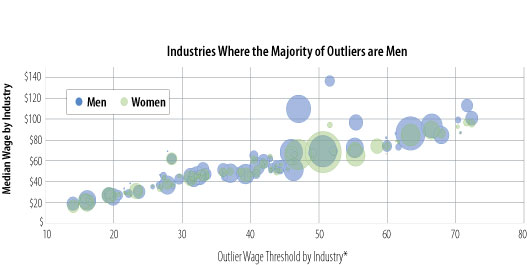
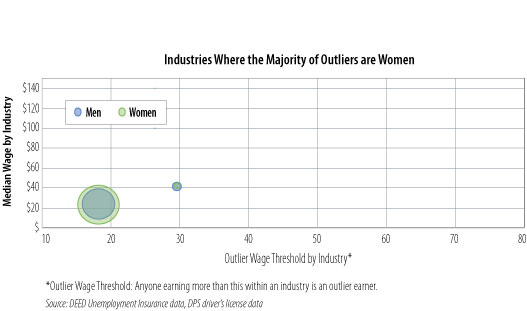
Men are disproportionately likely to be outlier earners in the majority of industries in Minnesota, and they tend to earn more as outliers than women (see Chart 1). The handful of industries where women are disproportionately likely to be outliers have both lower wages overall and outliers with much lower wages than in industries where males dominate as outliers. The charts below that represent expected performance (a similar number of male and female outliers), and majority women outliers have observations clustered around $20 per hour. The majority men chart, however, has industries with the outlier wage up to $72 per hour.


Results for specific industries bolster this finding (see Table 1). The overall median wage of industries with expected performance (similar numbers of male and female outliers) is $13.77 per hour. In those industries, men earn a median of $14.97 per hour to women's $13.25 per hour.
Table 1. Outlier Earners
| Wage | Industries with Expected Performance | Industries where Women Surpass Men | Industries where Men Surpass Women |
|---|---|---|---|
| Median Wage | $13.77 | $11.00 | $21.25 |
| Median Wage for Women | $13.25 | $11.02 | $20.03 |
| Median Wage for Men | $14.97 | $11.10 | $23.31 |
| Number of Workers | |||
| Total | 681,750 | 257,131 | 2,348,131 |
| Source: DEED Unemployment Insurance data, DPS driver's license data | |||
In industries where women surpass men as outlier earners, the overall median wage is only $11 per hour, and the gap between the median for women ($11.02 per hour) and the median for men ($11.10 per hour) is much smaller.1
In industries where men surpass women as outlier earners, the median wage overall is $21.25 per hour, or nearly double the wage for industries where women do disproportionally well as outliers. The gender gap here is greater, too – women earn $20.03 per hour compared with $23.31 per hour for men.
Most Minnesotans (71 percent) are employed in industries where men surpass women as outlier earners. Only 7.8 percent of workers are employed in industries where women surpass men as outlier earners.
In Table 2, the top 10 industries by total employment are shown. Highlighted industries are ones where female outliers outnumber male outliers. Across categories, men make up more than half of outlier earners. This means that even when women make up the majority of employment in an industry, men are disproportionately likely to be appointed to top positions. These industries include educational services, ambulatory health care services, hospitals and accommodation.
Health care and teaching are traditional pink-collar job powerhouses that pay well, but the data suggest that the administrators who manage them and the top doctors are still male-dominated. Furthermore, typically male outliers earn more than female outliers. This is particularly true in health care fields. The median hourly wage for male outlier earners is $110.07 to women's $65.75 in ambulatory health care services and $96.77 for men to $65.56 for women in hospitals.
Table 2. Top Industries by Employment and Outlier Performance
| - | - | Outlier Earners | |||
|---|---|---|---|---|---|
| Employment | Female | Median Wage Female | Male | Median Wage Male | |
| Industries With Similar Numbers of Men and Women | |||||
| Nursing and Care Facilities | 91,158 | 16,258 | $29.97 | 3,861 | $30.54 |
| Social Assistance | 78,475 | 14,058 | $23.89 | 4,179 | $25.10 |
| Admin. and Support Services | 68,933 | 12,913 | $33.96 | 18,402 | $33.91 |
| General Merchandise Stores | 39,235 | 6,050 | $20.50 | 4,490 | $21.12 |
| Amusement, Gambling and Recreation | 20,778 | 3,660 | $26.16 | 3,483 | $27.50 |
| Merchant Wholesalers, Non-Durable Goods | 16,007 | 2,675 | $63.37 | 5,784 | $67.02 |
| Construction of Buildings | 4,228 | 417 | $62.40 | 2,460 | $60.10 |
| Private Households | 3,491 | 479 | $26.50 | 86 | $29.98 |
| Warehousing and Storage | 2,162 | 325 | $62.39 | 653 | $57.13 |
| Non-Metallic Mineral Product Manufacturing | 1,640 | 244 | $40.29 | 1,267 | $39.90 |
| Industries With More Men than Women | |||||
| Educational Services | 179,195 | 24,182 | $68.77 | 14,241 | $69.60 |
| Ambulatory Health Care Services | 118,242 | 13,149 | $65.75 | 11,007 | $110.07 |
| Hospitals | 92,158 | 6,542 | $65.56 | 3,502 | $96.77 |
| Professional, Scientific, and Technical Services | 74,512 | 6,672 | $84.74 | 16,040 | $86.26 |
| Management of Companies and Enterprises | 45,649 | 4,709 | $89.74 | 8,268 | $93.75 |
| Credit Intermediation and Related Activities | 38,152 | 3,035 | $70.67 | 5,684 | $72.22 |
| Executive, Legislative and Other | 33,675 | 2,852 | $46.34 | 5,648 | $47.41 |
| Food and Beverage Stores | 30,654 | 4,118 | $19.96 | 5,599 | $22.33 |
| Religious and Grantmaking | 24,934 | 3,184 | $43.30 | 3,298 | $45.52 |
| Accommodation | 22,029 | 3,592 | $26.73 | 3,354 | $26.55 |
| Industries With More Women than Men | |||||
| Food Services and Drinking Places | 108,073 | 23,510 | $23.04 | 14,412 | $23.89 |
| Furniture and Related Product Manufacturing | 2,414 | 473 | $42.41 | 1,093 | $41.33 |
| Postal Services | 13 | 1 | $140.00 | 1 | $100.00 |
| Rail Transportation | 11 | 3 | $227.50 | 4 | $158.24 |
| Source: DEED Unemployment Insurance data, DPS driver's license data | |||||
Despite gains educationally and professionally over the past several decades, women are still less likely to be outlier wage earners than their male counterparts, even in industries where women generally do well. Gender wage parity and employment ratios, however, have been improving among younger workers and especially in industries that have more young people. We've seen progress toward gender balance in recent years and we should expect to see more going forward.
1The data set has missing values for gender. Records with a null value for gender are included in the total but not in the male or female medians.