
by Anthony Schaffhauser
March 2024
Variations of the idea that "Nobody wants to work anymore" have been said time and again for at least the last 130 years. Has it finally become true? Some people might suggest it, since Minnesota's labor force has grown by only a thousand workers since 2019 – meaning Minnesota's labor force has grown more slowly than North Dakota, South Dakota, Wisconsin, and the U.S. as a whole during the same time period. This lack of labor force growth since the enormous disruption of the COVID-19 pandemic is a critical issue to understand. While Minnesota’s Labor Force Participation Rate (LFPR) is one of the highest in the country, examining declines in LFPRs in some age groups in the state can shed some light on this issue. Minnesota employers need workers to thrive, and we want all Minnesotans with the capacity and desire to work to enter the labor force.
To understand what is really happening, we examine the three factors that affect labor force growth:
This article uses hypotheticals to isolate the effect of these factors, not to escape reality. The analysis also identifies LFPR declines in two age groups under age 65. We explore why LFPRs for these age groups declined.
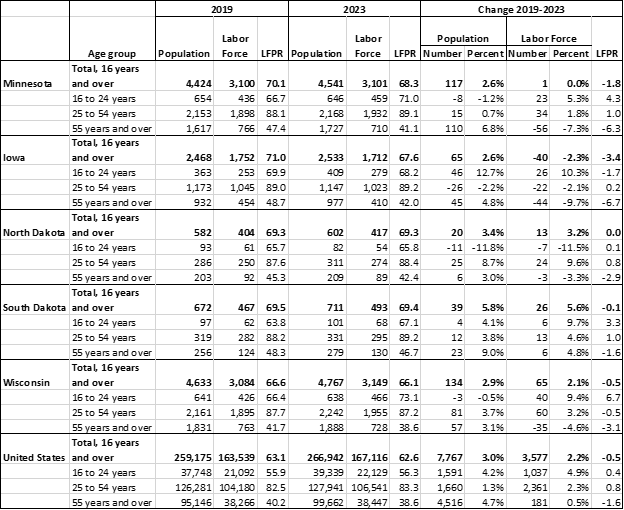
Minnesota's labor force increased by merely an estimated 1,000 workers from 2019 to 2023, showing virtually no growth. With total labor force estimates expressed in thousands, one thousand is essentially equivalent to a rounding error. Minnesota had slower labor force growth than our three border states to the east and west and the U.S. overall, but we are ahead of Iowa, whose labor force shrunk (see Table 1). While Minnesota's labor force aged 16 to 54 grew by 57,000 people, this was offset by the decline in the labor force aged 55 years and over, even though our population aged 55 years and over grew 6.8%. This means that Minnesota's labor force growth was held back entirely by the age 55-plus group, as was Wisconsin's labor force.
Table 1: Population, Labor Force, and Labor Force Participation Rate (LFPR) for Three Broad Age Groups, 2019 and 2023 (in thousands)
Source: U.S. Bureau of Labor Statistics, Local Area Unemployment Statistics, Expanded State Employment Status Demographic Data from the Current Population Survey, Accessed January 29, 2024.
*Note: 2023 State Data is preliminary, "but it is expected that the data—particularly for labor force participation rates... will be little changed for common state demographic groups."
Specifically, population in Table 1 is the civilian, non-institutionalized age 16 and older population in 2019, prior to the COVID-19 pandemic, and 2023, the most recent annual data. (From here on, "population" refers to the working-age population.) Minnesota's population grew 2.6%, tied with Iowa for slowest growth, and somewhat less than Wisconsin (2.9%) and the U.S. (3.0%). At 3.4%, North Dakota grew faster than the U.S., while South Dakota grew the fastest at 5.8%.
How much of the difference in Minnesota's labor force growth is attributable to population growth? Let's do a mental experiment. Suppose Minnesota's population grew at the same rate as South Dakota, which had the fastest growth in the 5-state region. South Dakota's 5.8% growth was around 39,000 people, but because Minnesota has a much larger population to start, Minnesota's population would need to increase by 257,000 people to match South Dakota's 5.8% growth rate, or 140,000 more people on top of Minnesota's population growth of 117,000 that we actually gained. This goes a long way in explaining the difference in labor force growth. However, Minnesota would have to add nearly seven times as many people to match the smaller state's larger percentage growth.
That said, with Minnesota's 2023 LFPR of 68.3%, our labor force would have increased by about 97,000 workers, or +3.1%, from a hypothetical 5.8% population increase. So, 3.1% of Minnesota's 5.6% labor force growth difference from South Dakota is attributable to the population growth difference. Why would Minnesota's labor force growth lag 2.5% behind South Dakota's even if we hypothetically matched South Dakota's population growth?
It is important to note that the change in the total LFPR for the entire age-16-plus population is determined by both the age distribution and the labor force participation rate for each age group. Both factors are why hypothetically applying the same population increase as South Dakota to Minnesota did not result in the same labor force increase. So, while some may point to Minnesota's -1.8 point LFPR decline for the total population age 16-plus from 2019 to 2023 compared to an unchanged rate for South Dakota to explain it all, it doesn't really explain much.
Hypothetically, if Minnesota had the same LFPRs for each age group as South Dakota in 2023 (with the same 2023 Minnesota population), our 2023 labor force would have been 73,000 workers larger, or 2.4%. So, the LFPR differences by age, all else being equal, would have a somewhat lesser impact than the population growth difference, all else equal.
Table 1 shows that LFPR declines were isolated to the age 55-plus group for Minnesota, its border states, and the U.S., with the sole exception of the 1.7 point decline for age 16 to 24 in Iowa. But that 1.7 point decline is dwarfed by Iowa's 6.7 point LFPR decline for age 55-plus. So, lower LFPR for age 55-plus is an issue across the board. However, it is more of an issue in Minnesota.
To see this, it is helpful to focus on LFPR change. Note that the change is all that matters for labor force growth (see Figure 1). Minnesota's age 55-plus LFPR declined -6.3 points, from 47.4% in 2019 to 41.1% in 2023, the second largest decline next to Iowa. South Dakota's -1.6 point LFPR drop for aged 55-plus was tied with the U.S. overall for smallest decline. In contrast, Minnesota's age 25-54 LFPR tied with South Dakota for the biggest increase with a 1 point gain, from 88.1% in 2019 to 89.1% in 2023, while Minnesota's age 16-24 LFPR increased 4.3 points, from 66.7% to 71.0%, more than South Dakota and second behind Wisconsin. If the idea was that young people don't want to work, that does not match the data at all. In terms of LFPRs, the larger decline for aged 55-plus is the only thing holding Minnesota back; our age 25 to 54 LFPR tied for biggest increase and our age 16 to 24 LFPR was second.
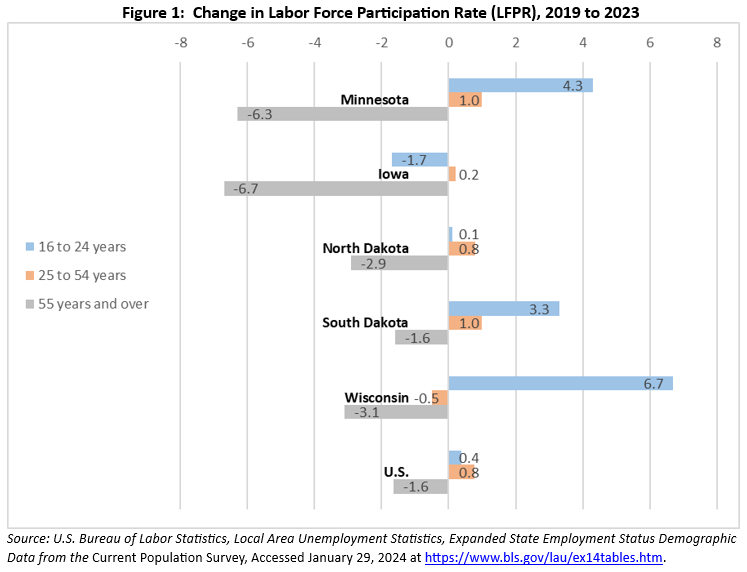
As noted, Minnesota's aged 55-plus labor force declined, canceling out gains in the two younger age groups, but this was not solely due to the -6.3 point LFPR decline for aged 55-plus. It is also because the population aged 55-plus increased 6.8%, while the 16-24 population declined and the 25-54 population grew a much slower 0.7%. Compared to 2019, more Minnesotans were in this 55-plus age group which has a lower LFPR, pulling down labor force growth.
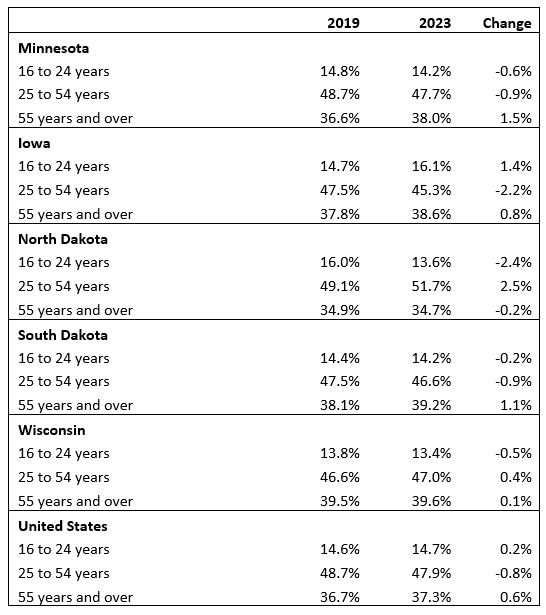
Minnesota's share of the population aged 55-plus increased the most compared to the U.S. as a whole and our four border states at 1.5%, from 36.6% in 2019 to 38.0% in 2023 (see Table 2). So even though Minnesota's percentage of the population aged 55-plus is third smallest, it is the change that matters for labor force growth. This means Minnesota's aging population is a bigger factor holding back our labor force growth compared to our border states and the U.S. as a whole.
In contrast, North Dakota's age 25 to 54 population increased the most, and this group has the highest LFPR.1 North Dakota's share of the population aged 55-plus actually decreased 0.2% from 2019 to 2023, while every other border state and the U.S. increased. Thus, the age distribution effect is the largest between Minnesota and North Dakota. If Minnesota had the same population percentages by age as in North Dakota in 2023,all else equal, we would have had 2.5% labor force growth, the equivalent of 76,000 additional workers.
Table 2: Population Percentage by Age and Change 2019 to 2023
Obviously, the reason the change in percent aged 55-plus matters so much is because this age group includes the impact of retirements. Minnesota's LFPR decline in the 55-plus age group suggests more retirements in Minnesota. Why would this be?
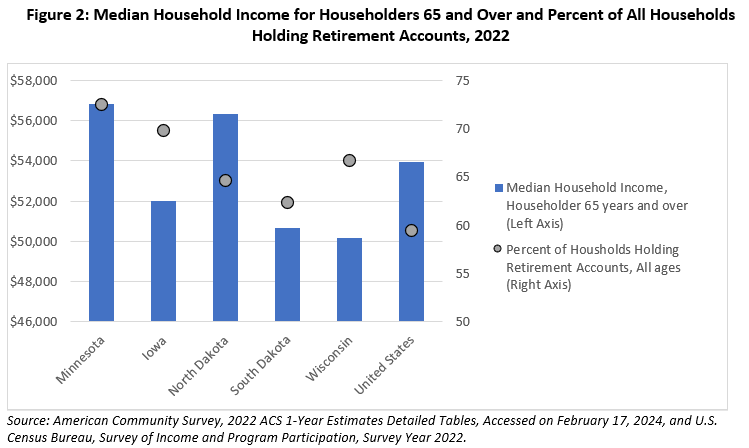
The percent of households with the means to retire is bound to be a strong factor shaping a state's share of retired persons. Among Minnesota, border states, and the U.S., Minnesota has the highest median household income for householders aged 65 years and over. Minnesota also has the highest percent of all households holding a retirement account (see Figure 2).
More age detail for the 55-plus age group enlightens the analysis, because LFPRs drop progressively for older age cohorts. Unfortunately, the Current Population Survey (CPS) does not have enough responses to generate reliable estimates for more specific age groups in smaller states, so we had to use just three broad age groups for the border state comparison. However, we have data for Minnesota and are able to analyze how population change by age and LFPRs interact.
Table 3 shows that Minnesota's biggest population gain is in the age 65 and older group, and the LFPR is much lower than other groups, more evidence that retirements are behind Minnesota's lack of labor force growth. Additionally, the age 65-plus LFPR declined by -2.8 points from 2019. The age 55 to 64 LFPR declined an even greater -3.2 points, also an indicator of retirement. While the age 20 to 24 LFPR remains above the age 55 to 64 LFPR, the age 20 to 24 LFPR declined the most of any age group.
| Table 3: Minnesota Population, Labor Force, and Labor Force Participation Rate (LFPR) for Seven Age Groups, 2019 and 2023 | |||||||||
|---|---|---|---|---|---|---|---|---|---|
| Population group | 2019 | 2023* | Change 2019-2023 | ||||||
| Population | Labor Force | LFPR | Population | Labor Force | LFPR | Population | Labor Force | LFPR | |
| Total, age 16+ | 4,424,000 | 3,100,000 | 70.1 | 4,541,000 | 3,101,000 | 68.3 | +117,000 | 1,000 | -1.8 |
| 16 to 19 years | 300,000 | 144,000 | 48.0 | 291,000 | 179,000 | 61.5 | -9,000 | +35,000 | +13.5 |
| 20 to 24 years | 354,000 | 293,000 | 82.6 | 355,000 | 280,000 | 78.7 | +1,000 | -13,000 | -3.9 |
| 25 to 34 years | 787,000 | 691,000 | 87.7 | 742,000 | 656,000 | 88.4 | -45,000 | -35,000 | +0.7 |
| 35 to 44 years | 670,000 | 592,000 | 88.3 | 774,000 | 700,000 | 90.4 | +104,000 | +108,000 | +2.1 |
| 45 to 54 years | 695,000 | 615,000 | 88.4 | 651,000 | 577,000 | 88.6 | -44,000 | -38,000 | +0.2 |
| 55 to 64 years | 756,000 | 557,000 | 73.6 | 693,000 | 488,000 | 70.4 | -63,000 | -69,000 | -3.2 |
| 65 years + | 861,000 | 209,000 | 24.3 | 1,035,000 | 223,000 | 21.5 | +174,000 | +14,000 | -2.8 |
|
Source: U.S. Bureau of Labor Statistics, Local Area Unemployment Statistics, Expanded State Employment Status Demographic Data from the Current Population Survey, Accessed January 29, 2024 *Note: 2023 State Data is preliminary, "but it is expected that the data—particularly for labor force participation rates... will be little changed for common state demographic groups." |
|||||||||
Table 3 shows two factors holding back Minnesota's labor force growth: (1) LFPRs decline for three of seven age cohorts and (2) the aging population, with the biggest increase in the 65-plus years age group which has by far the lowest LFPR. Seeing the top-line LFPR for the total age 16 plus drop from 70.1 to 68.3 leads to questions about why Minnesotans' willingness or availability to work has dropped. However, if people are simply reaching traditional retirement age and have the means to retire, that is viewed differently than if younger age groups are not working.
What about if we look at the counterfactual instead, in order to identify whether (1) or (2) is more prominent. Let's consider two hypotheticals: (A) What if the LFPR stayed the same as 2019 for each age group? and (B) What if the percent of the population in each age group stayed the same as 2019 while the LFPR changed as it actually did?
Table 4 shows the results for hypothetical (A). It applies 2019 LFPR by age to the 2023 population to calculate the hypothetical 2023 labor force. This demonstrates that if LFPRs by age did not change from 2019, Minnesota's labor force would have increased by 3,000 or 4,000 workers (depending on how one wants to deal with rounding error).
| Table 4: Hypothetical (A) Labor Force Change with Labor Force Participation Rate Held Constant | ||||
|---|---|---|---|---|
| Population group | 2019 LFPR | 2023 Population | Hypothetical 2023 Labor Force if 2019 LFPR | Hypothetical Labor Force Change, 2019-2023 |
| 16 to 19 years | 48.0% | 291,000 | 140,000 | -4,000 |
| 20 to 24 years | 82.6% | 355,000 | 293,000 | 0 |
| 25 to 34 years | 87.7% | 742,000 | 651,000 | -40,000 |
| 35 to 44 years | 88.3% | 774,000 | 683,000 | +91,000 |
| 45 to 54 years | 88.4% | 651,000 | 575,000 | -40,000 |
| 55 to 64 years | 73.6% | 693,000 | 510,000 | -47,000 |
| 65 years and over | 24.3% | 1,035,000 | 252,000 | +43,000 |
| Sum of Age Groups | 4,541,000 | 3,104,000 | +3,000 | |
| Source: U.S. Bureau of Labor Statistics (BLS), Local Area Unemployment Statistics, Expanded State Employment Status Demographic Data from the Current Population Survey, Accessed January 29, 2024 at BLS, and author's calculations. | ||||
Table 5 shows the results of Hypothetical (B). It applies the 2019 population percentage by age group to the 2023 population and uses the actual 2023 LFPRs to calculate the hypothetical 2023 labor force. It shows that if the age distribution of the population did not change from 2019, while the population grew as it did, Minnesota's labor force would have increased by 79,000 workers.
| Table 5: Hypothetical (B) Labor Force Change with Population by Age Held Constant | |||||
|---|---|---|---|---|---|
| Population group | 2019 Population Percent by Age Group | Hypothetical 2023 Population if 2019 Percent by Age Group | 2023 LFPR | Hypothetical 2023 Labor Force if 2019 Percent by Age Group | Hypothetical Labor Force Change, 2019-2023 |
| 16 to 19 years | 6.8% | 308,000 | 61.5% | 189,000 | +45,000 |
| 20 to 24 years | 8.0% | 363,000 | 78.7% | 286,000 | -7,000 |
| 25 to 34 years | 17.8% | 808,000 | 88.4% | 714,000 | +23,000 |
| 35 to 44 years | 15.1% | 688,000 | 90.4% | 622,000 | +30,000 |
| 45 to 54 years | 15.7% | 713,000 | 88.6% | 632,000 | +17,000 |
| 55 to 64 years | 17.1% | 776,000 | 70.4% | 546,000 | -11,000 |
| 65 years and over | 19.5% | 884,000 | 21.5% | 190,000 | -19,000 |
| Sum of Age Groups | 100.0% | 4,540,000 | - | 3,180,000 | +79,000 |
| Source: U.S. Bureau of Labor Statistics, Local Area Unemployment Statistics, Expanded State Employment Status Demographic Data from the Current Population Survey, Accessed January 29, 2024 at BLS, and author's calculations. | |||||
These hypotheticals make abundantly clear that the lack of labor force growth in Minnesota is due more to the aging population than declines in the LFPRs by age. Retirements are driving the lack of labor force growth. However, it is wholly unfathomable that we could grow our population to match 2019's age distribution. Our population is aging, as is the U.S. population. The mental experiment of holding the age distribution constant is very useful to demonstrate why our labor force has not grown faster, but it would be unreasonable to suggest we could make it reality, at least not until Generation Z is fully in the labor force. In the meantime, retaining more college age Minnesotans (18-24) would help to shore up our younger population demographic. (Journeys to and from the North Star State: Understanding Minnesota's Complex Migration Patterns in the 21st Century, Minnesota Economic Trends, March 2024)
Since reversing the aging population is unfeasible, it is useful to focus on the two age groups younger than age 65 that had LFPR declines. Recall the age 20 to 24 LFPR declined the most, followed by the age 55 to 64 LFPR. Age 65-plus declined third most. Examining the change in employment by sex for these age groups shows drastic differences by sex. However, the CPS-derived estimates we used up to now for LFPRs have far too large margins of error for reliable comparisons of males and females within age groups.
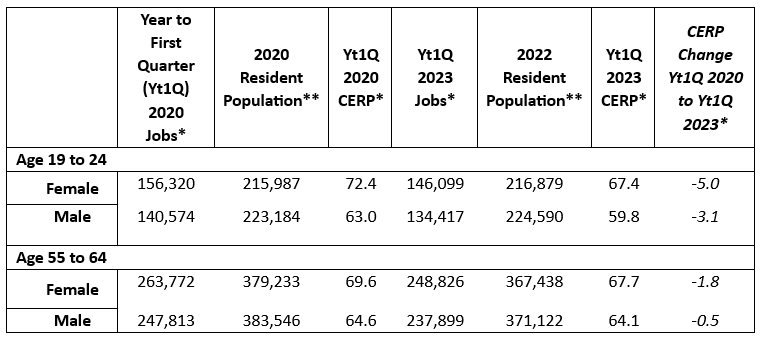
Instead, we use employment by age and sex for all jobs covered by Unemployment Insurance from Quarterly Workforce Indicators (QWI). This is essentially all wage and salary employment but excludes self-employment and contract employment. Because QWI is derived from administrative records rather than a survey sample, it does not have sampling error. We also use population estimates of Minnesota residents to calculate a "Covered Employment to Resident Population ratio" (CERP). Note that employment-to-population ratio is LFPR excluding the unemployed. It is conceptually similar to LFPR, allowing us to reliably see how employment by sex within age groups has changed while controlling for population changes.
A disadvantage of these data is that the most recent QWI is first quarter 2023. So, we don't yet know how CERP by sex changed in 2023. Table 6 uses average annual employment to first quarter 2023 compared to the same four quarters averaged to first quarter 2020. This is the most recent data compared to the same quarters as close to start of the pandemic as possible. One slight additional wrinkle is that the age group cut off for these data is age 19, not 20 as with the CPS.
The result is a CERP decline 1.6 times greater for females than for males aged 19 to 24. For aged 55 to 64, the CERP decline is 3.6 times greater for females than males.
Table 6: Change in Minnesota Covered Employment to Resident Population Ratio (CERP) by Sex for Selected Age Groups
Source: Quarterly Workforce Indicators (QWI) – U.S. Census Bureau, Center for Economic Studies, LEHD
Population Estimates – U.S. Census Bureau, Population Division; Release date: June 203, and Author’s calculations.
*Based on average employment for the four quarters to the beginning of first quarter of 2020 (Yt1Q 2020) and Yr1Q 2023.
** Population estimates used are for April 2020 and July 2022.
One would suspect that the larger drop for females aged 19 to 24 is from the fact that female college enrollment has been trending up relative to males for a long time. However, college enrollment is down for both males and females since the pandemic. According to Minnesota's Statewide Longitudinal Education Data System (SLEDS), college enrollment up to twelve months after high school graduation was 69% in 2019 and dropped progressively to 60% in 2022. Female college enrollment dropped 8 percentage points from 2019 to 2022, while males dropped 9 points. Female college enrollment dropped from 75% in 2019 to 67% in 2022, while males dropped from 63% to 54%.
While college enrollment dropped 1 point less for females, if enrollment were inversely related to CERP, we would expect CERP for both males and females to increase, not decrease, between year-to-first-quarter (Yt1Q) 2020 and Yt1Q 2022. Decreased college enrollment does not show an increase in CERP using four-quarter-average QWI employment, nor did it show an increase in the age 20 to 24 LFPR for both sexes in the independently produced, CPI-based data. Plus, CERP for females aged 19 to 24 was significantly higher than for males in Yt1Q 2020 and Yt1Q 2023. If that 1-point smaller drop in female college enrollment from 2019 to 2022 discernably contributed to the larger drop in female CERP from Yt1Q 2020 to Yt1Q 2023, then we would expect to see lower female CERP than male CERP in Yt1Q 2020 when 2019 female college enrollment was 12 points higher than for males. Also, we would expect to see lower CERP for females than males in Yt1Q 2023 when female college enrollment was 9 points higher than for males. So, college enrollment does not explain the greater CERP drop for females aged 19 to 24.
What remains a plausible explanation is caregiving. The childcare impact on employment is anecdotally well known, and data on the decreasing availability of childcare back it up. A May 2023 Federal Reserve Bank of Minneapolis article states, "since the pandemic began, and especially in the last couple of years, the decline of [family child care] providers has accelerated while the growth in [child care center] providers has slowed." An October 2023 follow up article states, "the total number of child care businesses is still in decline, and so is the number of children these businesses can care for."
There are also national data indicating that lack of childcare keeps parents out of the labor force. A July 2023 Federal Reserve Bank of St. Louis article used CPS microdata for the U.S. to discover, "a larger share of nonworking parents of young children... report child care needs as the main reason..." and "This fraction increased from about 15% prior to the pandemic to 18% in February 2023."
Studies of labor force participation of parents tend to look at differences by age of the children, not of the parents, like this April 2023 article by the Federal Reserve Bank of St. Louis that finds, "...women with children under 6 tend to have a lower LFPR than women with older children." However, it is reasonable to expect that females aged 19 to 24 are more likely to have infants or preschool children than older children, thereby pulling down the LFPR in this age group.
What's more, caregiving over work is not necessarily for one's own children. Females aged 19 to 24 could be caring for other family members including both younger and older family members. For those aged 55 to 64, there is ample anecdotal evidence of early retirement to care for grandkids and elderly parents. It is reasonable to expect this caregiving in lieu of employment would be highest for those outside the age 25 to 54 prime working years.
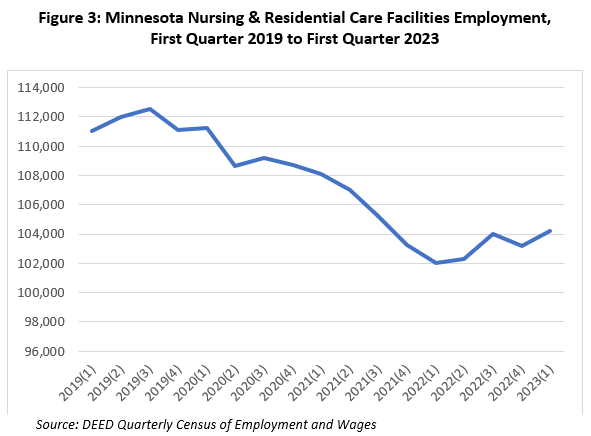
Even though a July 2023 Federal Reserve Bank of Minneapolis article analyzing national data on caregiving and employment focused on the prime working years age 25 to 54, it found, "the single most important fact about full-time caregivers is that they're primarily women." It also found that "around 18 percent of full-time caregivers report no children in their homes. Many in this minority of childless caregivers are adults who are living with their parents and may be caring for them." Indeed, the employment drop in Nursing & Residential Care Facilities over this CERP analysis time period means that a significant portion of care for the elderly shifted to family (see Figure 3).
It is worth noting that this same pattern of greater CERP decline for females aged 19 to 24 and 55 to 64 also appears in Minnesota's border states. The one exception is that North Dakota males aged 19 to 24 have greater CERP decline than females, but this may be due to pauses in oil production leaving young males temporarily out of work.
As this article establishes, Minnesota's lack of labor force growth is mainly due to retirements. Most would have guessed that without reading this article, but the difference in labor force growth compared to our border states deserves explanation. It is due to slower population growth, lower labor force participation for those aged 55 years and over, and the largest increase in the percent of the population aged 55 and over. Those 55 and over are likely leaving the labor force for retirement, and higher income and prevalence of retirement accounts enables Minnesotans to retire more readily than residents of our neighboring states.
However, there is really no reason besides social convention that people do not question why someone would stop work at age 65 or even younger. If a person wants to retire and can afford to, great. But are workers and employers fully exploring other options? Anyone in their late fifties or older would say they are retired if they are not working, but how many would prefer to work if they had an arrangement conducive to caregiving or a "work-life balance" tilted more to life? Could there be more of a gray area between the current often binary choices of working or retired that would benefit both workers and employers?
It is easy, but incorrect, to view the decreased headline LFPR for the total age 16 and over population and think there is a decrease in Minnesotans' willingness to work. This analysis shows that the change in our age profile, that is our aging population, determined over 96% of the labor force change (that is, lack of growth) from 2019 to 2023 and that labor force participation change is just 4% of the issue. It is important to bust the myth that our tight labor market is caused by young people who just don't want to work. The fact is retirements of those 55 and over is what is holding back labor force growth. LFPRs have increased for all younger age groups, except those aged 20 to 24.
The LFPR change by age is important because it suggests the underlying reasons and potential opportunities. One reason is caregiving impacting mostly females aged 19 to 24, and aged 55 to 64. These are the age groups right before and just after the so-called "prime working years" of age 25 to 54. No doubt caregiving affects labor force participation of males and people of different ages, but the detailed age and sex analysis reveals that females in these two age groups are those most impacted. Solutions can be implemented for all ages and both sexes.
One solution is more of what many employers have already been doing: more schedule flexibility. Another is helping childcare and elder care providers, as well as those who care for people of all ages with disabilities. Another potential opportunity is to encourage higher education or competency-based certification for caregivers aged 19 to 24. That way when children grow to at least school age or elderly family members no longer need caregiving, the erstwhile caregivers in their prime working years can transition to employment wielding more valuable knowledge and skills.
In addition, measures to retain more college age Minnesotans and encourage more migration to the state, such as the initiative just announced by Explore Minnesota may help counter the declines in younger population groups. Related to this, housing and community development initiatives to help younger workers find a place to live near employment opportunities are critically important.
Finally, we should also question our assumptions about the need to match our faster labor force growth of the past. Further automation and use of artificial intelligence could decrease the need for labor force growth. For example, Manufacturing, Transportation and other industries have already shown that new technology can help achieve greater productivity with fewer workers. Perpetually low unemployment with workers focused on the daily tasks that are most in need of the "human touch" might be a feasible, even desirable, alternative.
The labor force can grow for three reasons: (1) population growth, (2) increased LFPRs, and (3) favorable age profile change. Minnesota's population growth was tied for slowest in our 5-state region. Our LFPRs increased for ages under 55 years but had the second largest decrease for aged 55 and over. Our percentage of the population aged 55-plus, while smaller than all except North Dakota and the U.S., increased the most among border states and the U.S. as a whole from 2019 to 2023. Moreover, higher household incomes and access to retirement accounts in Minnesota compared to neighboring states is likely helping a higher share of Minnesota workers retire. Minnesota's aging population was almost entirely responsible for our lack of labor force growth. Labor force participation declined in only two age groups under age 65: aged 20 to 24 and aged 55 to 64. Caregiving, mainly by females, is identified as a plausible reason.
1North Dakota's outsized growth in workers aged 25 to 54 is attributable to the influx of workers for the oil extraction industry.