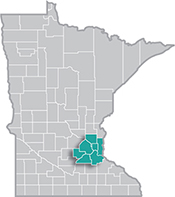
 The Minneapolis-St. Paul metropolitan area is a national leader in finance, advanced manufacturing, agriculture and retailing.
Medical devices, electronics and processed foods are strong suits recognized globally.
Want the freshest data delivered by email? Subscribe to our regional newsletters.
8/3/2020 9:00:00 AM
Tim O'Neill
The impacts of COVID-19 have thoroughly spread throughout national, state, and regional labor markets. In the most recent employment numbers available, for June 2020, the unemployment rate for the Seven-County Metro Area hit 9.3%. This represented approximately 164,100 unemployed persons. Meanwhile, between the months of March and June, nearly 500,000 claims for Unemployment Insurance (UI) were filed in the region, accounting for 58% of the state's total claims during that time. For reference, the Metro Area unemployment rate was at 2.9% in February, which represented approximately 48,600 unemployed persons. UI claims filed during that month were just under 6,800.
The increases in unemployment and UI claims within the Metro can be attributed to the furloughs and layoffs businesses implemented to adhere with pandemic safety measures, as well as change in demand and other economic stresses caused by COVID-19. Most of the businesses within the region are small businesses. In fact, as of 2018, over nine-in-ten Metro Area businesses had less than 50 employees. Over four-in-five businesses had less than 20 employees. Just over half of the region's businesses had fewer than five employees (see Table 1).
| Table 1. Employers by Size Class in the Seven-County Metro Area, 2018 | Minnesota Percent of Firms, 2018 | ||||
|---|---|---|---|---|---|
| Number of Employees | Number of Firms | Percent of Firms | Change in Number of Firms, 2008-2018 | ||
| 1-4 | 45,269 | 53.3% | +1,259 | +2.9% | 53.5% |
| 5-9 | 13,687 | 16.1% | +152 | +1.1% | 17.6% |
| 10-19 | 11,011 | 13.0% | +44 | +0.4% | 13.2% |
| 20-49 | 8,789 | 10.4% | +908 | +11.5% | 9.6% |
| 50-99 | 3,294 | 3.9% | +256 | +8.4% | 3.3% |
| 100-249 | 1,949 | 2.3% | +105 | +5.7% | 1.9% |
| 250-499 | 560 | 0.7% | +98 | +21.2% | 0.5% |
| 500 or more | 186 | 0.2% | +13 | +13.3% | 0.2% |
| Total Firms | 84,867 | 100.0% | +2,835 | +3.5% | 100.0% |
| Source: U.S. Census, County Business Patterns | |||||
Table 2 reveals the number and share of small businesses (in this case, less than 20 employees) by industry sector for the Minneapolis-St. Paul Metropolitan Statistical Area (MSA). As an example, about 91% of businesses within the Other Services sector have fewer than 20 employees. Other Services includes Personal Care Services, an industry that has been hit especially hard by COVID-19.
| Table 2. Small Businesses by Industry Sector in the Minneapolis-St. Paul Metropolitan Statistical Area (MSA), 2018 | |||||
|---|---|---|---|---|---|
| Industry Sector | Number of Employees | Share of Total Firms with Fewer than 20 Employees | |||
| Total Firms | 1-4 | 5-9 | 10-19 | ||
| Total, All Industries | 97,449 | 52,561 | 15,936 | 12,520 | 83.1% |
| Agriculture | 132 | 94 | 27 | 8 | 97.7% |
| Mining | 50 | 21 | 9 | 9 | 78.0% |
| Utilities | 148 | 54 | 21 | 19 | 63.5% |
| Construction | 9,998 | 7,281 | 1,216 | 718 | 92.2% |
| Manufacturing | 4,538 | 1,611 | 741 | 656 | 66.3% |
| Wholesale Trade | 5,387 | 2,769 | 880 | 716 | 81.0% |
| Retail Trade | 10,374 | 3,857 | 2,340 | 2,151 | 80.5% |
| Transportation & Warehousing | 2,560 | 1,511 | 292 | 266 | 80.8% |
| Information | 1,842 | 958 | 315 | 236 | 81.9% |
| Finance & Insurance | 6,052 | 3,737 | 1,037 | 603 | 88.8% |
| Real Estate, Rental, & Leasing | 5,513 | 4,355 | 585 | 302 | 95.1% |
| Professional, Scientific, & Technical Services | 13,358 | 9,946 | 1,401 | 928 | 91.9% |
| Management of Companies | 986 | 298 | 139 | 135 | 58.0% |
| Administrative & Support Services | 5,467 | 3,358 | 759 | 491 | 84.3% |
| Educational Services | 1,515 | 658 | 226 | 243 | 74.4% |
| Health Care & Social Assistance | 10,990 | 4,122 | 2,460 | 1,997 | 78.1% |
| Arts & Entertainment | 1,877 | 1,024 | 293 | 207 | 81.2% |
| Accommodation & Food Services | 7,232 | 1,686 | 1,071 | 1,625 | 60.6% |
| Other Services | 9,320 | 5,116 | 2,121 | 1,208 | 90.6% |
| Source: U.S. Census, County Business Patterns | |||||
The Department of Employment and Economic Development (DEED) has numerous resources to assist small businesses. The Small Business Assistance Office and Small Business Development Centers provide consulting services, guidebooks, licensing information, and training opportunities.
General information and resources available to businesses can be found on the DEED website, as well as information on how businesses can navigate through COVID-19.
Contact Tim O'Neill, Labor Market Analyst.