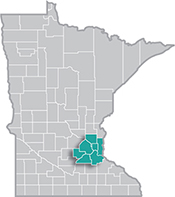
 The Minneapolis-St. Paul metropolitan area is a national leader in finance, advanced manufacturing, agriculture and retailing.
Medical devices, electronics and processed foods are strong suits recognized globally.
Want the freshest data delivered by email? Subscribe to our regional newsletters.
4/13/2022 9:00:00 AM
Tim O'Neill
In Minnesota, tech workers are concentrated in the metro – with almost half of them based in Hennepin County. Computer and mathematical jobs on the whole pay much more than the average wages across all occupations. Women currently hold about a quarter of all tech jobs in Minnesota. Read on for more details about tech employment – which isn't a sector on its own, but a set of occupations working across all industry sectors – and an increasingly important part of the state's economy.
With labor market data, Information Technology (IT) is most closely associated with Computer and Mathematical occupations. This major occupational group accounts for approximately 85,000 jobs in the Seven-County Metro Area, which represents over 85% of Minnesota's total employment in this group. For reference, the Metro Area accounts for about 63% of the state's total employment across all occupational groups. Where Computer and Mathematical occupations account for 3.6% of Minnesota's total employment, they account for 4.9% of the Metro Area's total employment. In other words, Computer and Mathematical occupations are highly concentrated within the Metro Area. It should be noted that these occupations are employed across all industry sectors.
Table 1 reveals specific employment and wage data for Computer occupations within the Metro Area. As can be seen, not only are they in high demand, they also offer higher wages. The largest-employing IT occupation, Software Developers and Software Quality Assurance Analysts and Testers, has a median hourly wage of $52.74. Working full-time and year-round, this equates to $109,699. This is more than twice the respective median annual income for a full-time and year-round worker across all industries, which is $51,854.
| Table 1. Metro Area Computer Occupations Employment Statistics
Sorted by Employment |
|||||
|---|---|---|---|---|---|
| SOC Code | Occupational Title | Employment | Hourly Wage Percentiles | ||
| 25th | Median | 75th | |||
| 0 | Total, All Occupations | 1,697,060 | $16.73 | $24.93 | $38.95 |
| 150000 | Computer and Mathematical Occupations | 83,760 | $34.48 | $46.25 | $58.90 |
| 151256 | Software Developers and Software Quality Assurance Analysts and Testers | 28,720 | $42.25 | $52.74 | $63.44 |
| 151211 | Computer Systems Analysts | 16,280 | $37.92 | $48.14 | $59.93 |
| 151232 | Computer User Support Specialists | 9,480 | $22.50 | $27.92 | $33.96 |
| 151244 | Network and Computer Systems Administrators | 4,930 | $35.64 | $44.01 | $51.93 |
| 151231 | Computer Network Support Specialists | 3,860 | $27.54 | $33.74 | $41.14 |
| 151299 | Computer Occupations, All Other | 3,820 | $33.38 | $44.70 | $58.26 |
| 151251 | Computer Programmers | 2,490 | $36.08 | $45.58 | $52.06 |
| 151245 | Database Administrators and Architects | 2,430 | $40.69 | $52.68 | $64.01 |
| 151257 | Web Developers and Digital Interface Designers | 2,320 | $29.82 | $39.27 | $52.36 |
| 151241 | Computer Network Architects | 2,290 | $49.39 | $60.10 | $70.60 |
| 151212 | Information Security Analysts | 2,130 | $39.74 | $49.92 | $61.70 |
| 151221 | Computer and Information Research Scientists | 210 | $56.21 | $66.87 | $78.89 |
| Source: DEED Occupational Employment and Wage Statistics | |||||
According to the U.S. Census Bureau's 2020 American Community Survey (ACS) 5-Year Estimates, the Seven-County Metro Area had approximately 85,600 workers in Computer and Mathematical occupations during the 2016-2020 period, of which just over one-quarter (25.2%) were female. This equates to an estimated 21,600 female workers. While significant, the share of female workers in Computer and Mathematical occupations is significantly lower than the female share of total employment in the region, 48.4%.
It should also be noted that female workers in Computer and Mathematical occupations earned, on average, $36,626 more than female workers across all occupations in the Metro Area. Even so, female workers in Computer and Mathematical occupations in the Metro earned about 85% of what their male counterparts earned. For the total of all occupations, female workers in the Metro earned about 72% of what their male counterparts earned.
| Table 2. Metro Area Civilian Employed Population 16+ in Computer and Mathematical Occupations, 2020 | |||||
|---|---|---|---|---|---|
| Area | Total
Employment |
Female
Employment |
Female Share | Female Median Annual Earnings | |
| Total Employment | Computer and Mathematical | ||||
| Anoka County | 7,067 | 2,039 | 28.9% | $39,139 | $73,384 |
| Carver County | 2,566 | 712 | 27.7% | $42,907 | $81,667 |
| Dakota County | 12,985 | 3,128 | 24.1% | $41,661 | $73,005 |
| Hennepin County | 41,089 | 9,892 | 24.1% | $43,122 | $75,241 |
| Ramsey County | 12,683 | 3,400 | 26.8% | $37,143 | $70,550 |
| Scott County | 3,764 | 1,095 | 29.1% | $42,336 | $93,675 |
| Washington County | 5,432 | 1,341 | 24.7% | $44,204 | $79,375 |
| Metro Area | 85,586 | 21,607 | 25.2% | $41,502 | $78,128 |
| Source: 2016-2020 American Community Survey 5-Year Estimates | |||||
Contact Tim O'Neill, Labor Market Analyst.