 The Minneapolis-St. Paul metropolitan area is a national leader in finance, advanced manufacturing, agriculture and retailing.
Medical devices, electronics and processed foods are strong suits recognized globally.
Want the freshest data delivered by email? Subscribe to our regional newsletters.
2/14/2023 9:00:00 AM
Tim O'Neill
According to the most recent estimates from the U.S. Census Bureau, the 7-county Twin Cities Metro Area's population declined over the past year. This was quite a reversal, after the metro added an average of more than 31,000 net new residents each year from 2010 to 2020. To understand the shift, let's take a look at the components of population change for the Metro Area and its counties (see Table 1).
| Table 1. Twin Cities Metro Area Components of Population Change, 2020-2021 | |||||||
|---|---|---|---|---|---|---|---|
| - | Total Population Change | April 1, 2020 to July 1, 2021 | |||||
| Natural Increase | Vital Events | Net Migration | |||||
| Births | Deaths | Total | International | Domestic | |||
| Twin Cities Metro Area | -9,225 | +12,410 | 45,203 | 32,793 | -21,638 | +2,917 | -24,555 |
| State of Minnesota | +896 | +12,512 | 79,493 | 66,981 | -11,734 | +4,213 | -15,947 |
| Source: U.S. Census Bureau, Population Estimates Program | |||||||
Each year, the Census Bureau's Population Estimates Program uses current data on births, deaths, and migration to calculate population change since the most recent decennial census. According to these estimates, the Metro Area's total population declined by 9,225 people between April 1, 2020, and July 1, 2021. The region grew due to a natural increase of 12,410 people, with more births than deaths during that period. However, the region witnessed a net migration loss of 21,638 people. In other words, more people are moving out of the Metro Area than in. This loss in net migration was entirely due to domestic migration patterns, which overcame the region's increase of 2,917 international immigrants between 2020 and 2021 (Table 1).
 The Metro Area's total population loss was due to losses in Hennepin County and Ramsey County. Like the region, both Hennepin and Ramsey counties witnessed natural increases to their respective populations, as well as growth from international immigration. Overall population losses were due to domestic migration patterns. Hennepin County lost 20,397 people to domestic out-migration between 2020 and 2021, while Ramsey County lost 11,942 more people than it brought in.
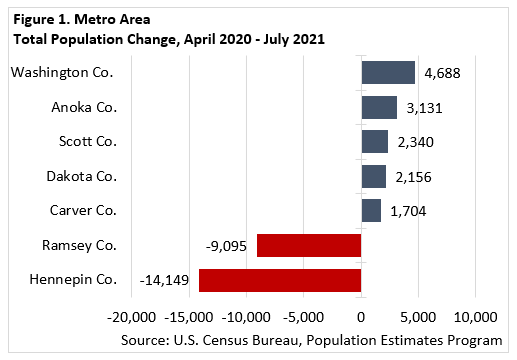
All other counties in the Metro Area witnessed net population growth between 2020 and 2021. This growth was led by Washington County, which saw its population increase by a total of 4,688 people during that period, and Anoka County, which saw its population increase by 3,131 people (Figure 1). Where every county in the Metro Area witnessed population growth from international immigration, only four counties witnessed positive domestic migration flows: Washington County, Anoka County, Scott County, and Carver County.
So, what's the story with domestic migration patterns in the Metro Area? One tool that can begin to shed light on this question is the U.S. Census Bureau's Migration Patterns tool. This tool specifically looks at the migration patterns of young adults in the United States. For example, between the ages of 16 and 26 years, many young adults from the Minneapolis-St. Paul metropolitan region moved to Chicago, Los Angeles, Denver, and New York.
Contact Tim O'Neill, Labor Market Analyst, at timothy.oneill@state.mn.us