 The Minneapolis-St. Paul metropolitan area is a national leader in finance, advanced manufacturing, agriculture and retailing.
Medical devices, electronics and processed foods are strong suits recognized globally.
Want the freshest data delivered by email? Subscribe to our regional newsletters.
1/26/2024 9:00:00 AM
Tim O'Neill
At the very end of 2023, the U.S. Census Bureau released updated estimates through the American Community Survey (ACS). These new 2022 5-year estimates are available for all geographies down to the census tract and block group levels. Additionally, the ACS data covers a wide array of vital information, including employment, income and poverty, housing, disability status, veteran status and more. Last month, we looked at labor force statistics and trends in the region. This month let's take a closer look at the Metro Area's educational attainment, zooming in upon educational attainment by location as well as by race and ethnicity.
According to the new 2022 5-year estimates, the 7-County Metro Area had a total population of 2,422,397 people who were 18 years of age and older. Of this population, more than nine out of every ten (93.3%) had a high school diploma/equivalent or more. This was compared to 93.0% for Minnesota and 89.0% for the United States. Nearly three-quarters (73.3%) of the Metro Area's population 18 years of age and older had some level of postsecondary education. This was compared to 68.5% for Minnesota and 61.8% for the United States. Finally, 43.6% of the Metro Area's population 18 years of age and older had a bachelor's degree or more. This was compared to 35.5% for Minnesota and 31.7% for the United States (Table 1).
| Table 1. Educational Attainment in the Metro Area, 2022 | ||||
|---|---|---|---|---|
| Population | Metro Area | Minnesota | ||
| Estimate | Share | Estimate | Share | |
| Population 18 Years & Over | 2,422,397 | 100.0% | 4,388,208 | 100.0% |
| Less than High School | 162,283 | 6.7% | 305,981 | 7.0% |
| High School Graduate (includes equivalency) | 483,634 | 20.0% | 1,076,325 | 24.5% |
| Some College or Associate Degree | 719,778 | 29.7% | 1,449,908 | 33.0% |
| Bachelor's Degree or More | 1,056,702 | 43.6% | 1,555,994 | 35.5% |
| Source: U.S. Census Bureau, American Community Survey 5-Year Estimates | ||||
Educational attainment in the Metro Area does vary a bit by county. For example, the share of persons 18 years of age and older with a bachelor's degree or more ranged from 29.4% in Anoka County to 49.4% in Hennepin County. It should be noted here that Anoka County's industry distribution leans more towards Manufacturing and Construction. These industries, while not requiring extensive levels of postsecondary education, have occupations with high wages and paths for career advancement. Meanwhile, Hennepin County's industry distribution leans more towards Professional & Business Services and Financial Activities. Occupations in these industries typically require bachelor's degrees or more (Table 2).
| Table 2. Metro Area Educational Attainment by County, 2022 | |||
|---|---|---|---|
| Area | Total Population 18 Years & Over | Share High School Grad or More | Share Bachelor's Degree or More |
| Anoka County | 277,906 | 93.3% | 29.4% |
| Carver County | 79,516 | 95.1% | 46.2% |
| Dakota County | 333,650 | 94.6% | 41.3% |
| Hennepin County | 995,622 | 93.4% | 49.4% |
| Ramsey County | 420,702 | 90.7% | 41.3% |
| Scott County | 111,192 | 93.7% | 39.8% |
| Washington County | 203,809 | 95.3% | 44.7% |
| Metro Area | 2,422,397 | 93.3% | 43.6% |
| Minnesota | 4,388,208 | 93.0% | 35.5% |
| Source: U.S. Census Bureau, American Community Survey 5-Year Estimates | |||
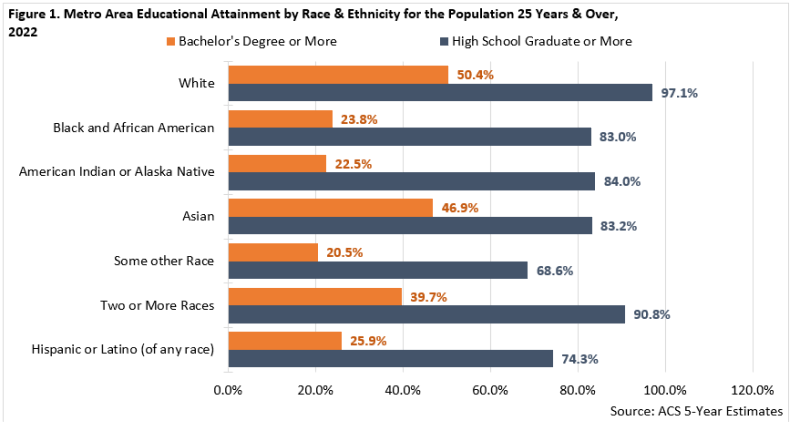
Educational attainment in the Metro Area also varies widely by race and ethnicity. For example, when analyzing the region's total population 25 years of age and older, the share of people obtaining at least a high school diploma or equivalent ranges from 68.6% for those reporting as Some Other Race to 97.1% for those reporting as white. Meanwhile, the share of people obtaining a bachelor's degree or more ranges from 20.5% for those reporting as Some Other Race to 50.4% for those reporting as white (Figure 1). Understanding educational attainment, along with disparities by race and ethnicity, is vital to understanding longer-term population and labor force statistics and trends.

For example, there is a strong relationship between higher levels of postsecondary education and income, along with lower levels of poverty and unemployment.
Contact Tim O'Neill, Labor Market Analyst, at timothy.oneill@state.mn.us.