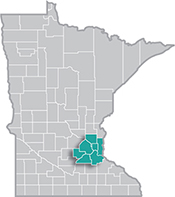
 The Minneapolis-St. Paul metropolitan area is a national leader in finance, advanced manufacturing, agriculture and retailing.
Medical devices, electronics and processed foods are strong suits recognized globally.
Want the freshest data delivered by email? Subscribe to our regional newsletters.
6/17/2024 12:48:28 PM
Tim O'Neill
The Department of Employment and Economic Development (DEED) recently released brand new data from its Job Vacancy Survey (JVS). This data, which showcases hiring demand across Minnesota and its regions in 2023, reveals high hiring demand in Health Care & Social Assistance. If you've followed past Local Look blogs, this high hiring demand from all regions of the state will come as no surprise. Health Care is huge in Minnesota. It's the largest-employing industry sector, and the demand for health care services continue to track high as the state's population continues to age. The month, we'll take a close look at the latest hiring data for Health Care in the Metro Area.
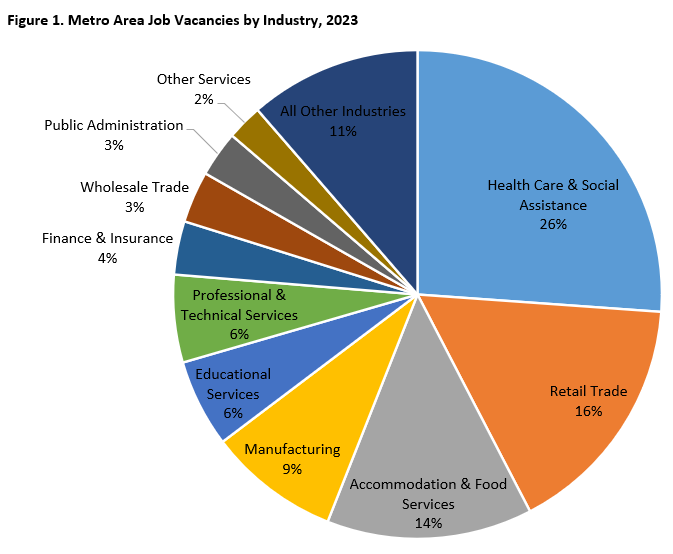
Getting right to the numbers, DEED's JVS shows Health Care & Social Assistance had nearly 20,500 job vacancies in the Metro Area in 2023. This was, far and away, the most job vacancies for any industry in the region. Where Health Care & Social Assistance accounted for 16.6% of the Metro Area's total covered employment in 2023, the industry accounted for 26.1% of the region's total job vacancies (Figure 1).

For those 20,500 Health Care & Social Assistance job vacancies, just over half (56%) required some level of postsecondary education. More specifically, 19% did not require any formal education, 25% required a high school diploma or equivalent, 9% required vocational training, 25% required an associate degree, and 22% required a bachelor's degree or more. The median hourly wage offer for all job vacancies in Health Care & Social Assistance, $21.92, was just a bit higher than the median hourly wage offer for the total of all job vacancies across all industries, $20.47.
Of course, Health Care & Social Assistance accounts for a wide variety of occupational groups and specific occupations. The two occupational groups with the most demand in Health Care & Social Assistance include Healthcare Practitioners & Technical occupations, such as doctors and nurses, and Healthcare Support occupations, like Personal Care Aides and Nursing Assistants.
In 2023, the Metro Area had over 14,800 job vacancies between these two occupational groups. Zooming in on these occupational groups, the specific occupations with the most job vacancies included Personal Care Aides, Registered Nurses and Nursing Assistants. Together these three occupations accounted for over 6,500 job vacancies. Other specific occupations with high numbers of job vacancies included Medical Assistants, Licensed Practical & Licensed Vocational Nurses, Dental Hygienists and Psychiatric Technicians.
Table 1 reveals specific job vacancy characteristics for these occupations, including the share of job vacancies requiring postsecondary education, the share requiring at least one year of work experience, and median wage offers. Visit DEED's Job Vacancy Survey tool to learn more about health care demand in the Metro Area.
| Table 1. Metro Area Healthcare Occupations with the Most Job Vacancies, 2023 | |||||
|---|---|---|---|---|---|
| Occupation | Number of Job Vacancies | Share Part Time | Share Req. Postsecondary Education | Share Req. 1+ Years of Work Experience | Median Wage Offer |
| Total, All Occupations | 78,325 | 27% | 39% | 50% | $20.47 |
| Healthcare Practitioners & Technical Occupations | 8,747 | 30% | 92% | 67% | $34.12 |
| Healthcare Support Occupations | 6,088 | 37% | 27% | 28% | $17.84 |
| Personal Care Aides | 2,592 | 36% | 3% | 21% | $16.76 |
| Registered Nurses | 2,488 | 41% | 98% | 64% | $36.11 |
| Nursing Assistants | 1,432 | 51% | 31% | 21% | $18.13 |
| Medical Assistants | 815 | 16% | 53% | 66% | $19.15 |
| Licensed Practical & Licensed Vocational Nurses | 800 | 30% | 98% | 45% | $25.93 |
| Dental Hygienists | 523 | 44% | 100% | 84% | $38.50 |
| Psychiatric Technicians | 478 | 23% | 53% | 93% | $23.80 |
| Pharmacists | 391 | 7% | 100% | 93% | $42.33 |
| Home Health Aides | 360 | 63% | 39% | 6% | $17.81 |
| Pharmacy Technicians | 348 | 50% | 40% | 38% | $21.13 |
| Clinical Laboratory Technologists & Technicians | 330 | 16% | 76% | 72% | $24.87 |
| Radiologic Technologists & Technicians | 286 | 59% | 97% | 43% | $24.70 |
| Source: DEED Job Vacancy Survey | |||||
To discover more about health care employment in the Metro Area, Contact Tim O'Neill, Labor Market Analyst, at timothy.oneill@state.mn.us.