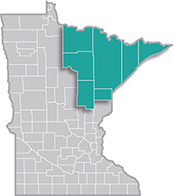
 Home to the state's second-largest metro, the Northeast Region has a strong industrial sector, tied largely to the area's abundant natural resources.
Most of the manufacturing base centers on mining and forest products industries. More than half of the sector's employment is in paper and machinery manufacturing.
Want the freshest data delivered by email? Subscribe to our regional newsletters.
7/7/2020 9:00:00 AM
Carson Gorecki
Much coverage has been given to the disproportionate impacts of the coronavirus pandemic across different demographic groups. Women, people of color, the less educated, and younger workers have all applied for unemployment benefits at higher rates across the country, state—and here in Northeast Minnesota. As businesses re-open or ramp-up operations, these workers will likely face differing obstacles. This is due in large part to their concentration in occupations that don't allow work from home and/or require work in close proximity to customers or others.
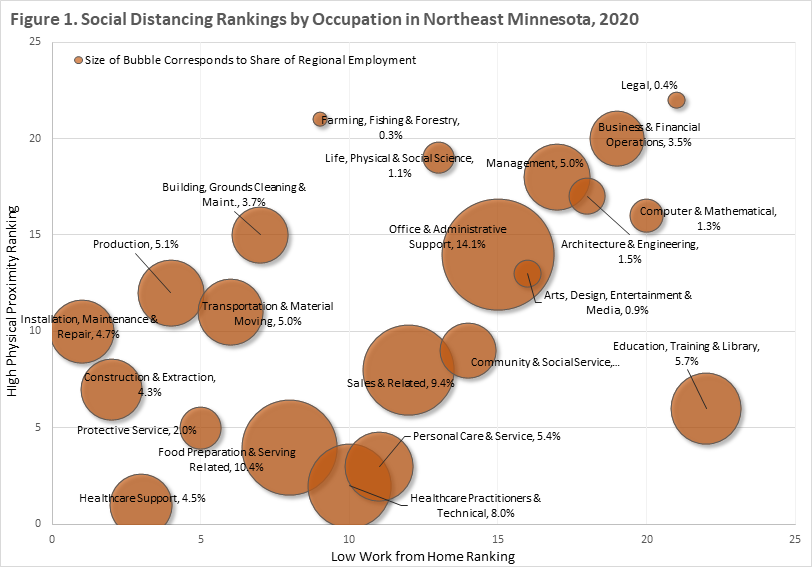
People whose jobs require them to work on-site and/or require them to be physically close to customers or others are more greatly impacted both by fewer jobs coming back due to social distancing restrictions, but also by the potential risk of exposure to virus that causes COVID-19. The Federal Reserve Bank of New York ranked all the major occupational groups based on information from a survey of workers. On their social distancing rankings, the higher the physical proximity score and the lower the work from home score the greater the impact of social distancing measures on a person's employment. (see Figure 1). Those jobs that depend on interpersonal interaction, such as patient-centric health care occupations, have high rankings in the physical proximity (PP) score. Meanwhile, jobs that require workers to be on-location such as construction and installation, maintenance and repair, have correspondingly low work from home (WFH) rankings.

By applying the New York Fed's social distancing rankings to Northeast Minnesota's occupation mix, we see some predictable trends, but can also glean some more nuanced observations. Office & administrative support occupations, for example, have low WFH and PP scores. Office and admin support occupations also have a relatively low share of UI claims compared to their share of overall employment, indicating avoidance of some of the worst effects from the pandemic. Similarly, legal and business & financial operations occupations had low social distancing rankings as much of the work can be accomplished remotely and without the need for physical contact. In this case, the lower rankings correlate with a relatively small share of UI claims.
On the other end of the spectrum, healthcare support had the highest combined social distancing scores. And while healthcare support occupations had a higher relative share of UI claims, it was not as high as food preparation & serving related which had lower social distancing scores, but a larger total count of UI claims. Construction & extraction occupations also ranked high in both social distancing categories, particularly in the work from home ranking–most construction work has to be done on site (see Table 1).
| Table 1. Occupations by Social Distancing Requirement Rankings in Northeast Minnesota, 2020 | ||||||
|---|---|---|---|---|---|---|
| Occupation | Low Work from Home Ranking | High Physical Proximity Ranking | Regional Share of Employment | Share of UI Claims (5/16-6/6) | Location Quotient | Median Hourly Wage |
| Healthcare Support | 3 | 1 | 4.5% | 5.7% | 1.35 | $15.36 |
| Construction & Extraction | 2 | 7 | 4.3% | 10.5% | 1.37 | $27.37 |
| Installation, Maintenance & Repair | 1 | 10 | 4.7% | 5.2% | 1.30 | $22.97 |
| Protective Service | 6 | 5 | 2.0% | 0.6% | 1.37 | $23.34 |
| Food Preparation & Serving Related | 9 | 4 | 10.4% | 19.5% | 1.25 | $11.61 |
| Healthcare Practitioners & Technical | 11 | 2 | 8.0% | 7.3% | 1.25 | $30.94 |
| Personal Care & Service | 12 | 3 | 5.4% | 4.0% | 1.00 | $12.55 |
| Production | 4 | 12 | 5.1% | 6.6% | 0.68 | $21.70 |
| Transportation & Material Moving | 7 | 11 | 5.0% | 3.7% | 0.81 | $18.06 |
| Sales & Related | 13 | 8 | 9.4% | 10.0% | 0.98 | $12.36 |
| Building, Grounds Cleaning & Maint. | 8 | 15 | 3.7% | 4.4% | 1.25 | $13.50 |
| Community & Social Service | 15 | 9 | 3.6% | 1.2% | 1.73 | $19.99 |
| Education, Training & Library | 23 | 6 | 5.7% | 3.4% | 0.99 | $24.01 |
| Office & Administrative Support | 16 | 14 | 14.1% | 7.7% | 0.97 | $17.20 |
| Arts, Design, Entertainment & Media | 17 | 13 | 0.9% | 2.1% | 0.78 | $20.02 |
| Farming, Fishing & Forestry | 10 | 21 | 0.3% | 1.2% | 1.57 | $21.02 |
| Life, Physical & Social Science | 14 | 19 | 1.1% | 0.1% | 1.11 | $29.94 |
| Management | 18 | 18 | 5.0% | 4.0% | 0.78 | $40.64 |
| Architecture & Engineering | 19 | 17 | 1.5% | 0.8% | 0.83 | $35.23 |
| Computer & Mathematical | 21 | 16 | 1.3% | 0.6% | 0.39 | $32.63 |
| Business & Financial Operations | 20 | 20 | 3.5% | 1.4% | 0.60 | $28.53 |
| Legal | 22 | 22 | 0.4% | 0.1% | 0.50 | $34.84 |
| Total, All Occupations | n/a | n/a | 100.0% | n/a | 1.00 | $18.57 |
| Note: Transportation & Material Moving was split into two occupational groups by the NY Fed. Their rankings were averaged for this table. Sources: New York Federal Reserve Bank, MN DEED Occupational Employment Statistics, MN DEED Unemployment Insurance Statistics. | ||||||
Perhaps of most significance to the region, many of the occupations with high physical proximity scores are more concentrated in Northeast Minnesota when compared to the state. The location quotients for healthcare, construction, food preparation, and installation, maintenance & repair occupations are all greater than 1.0, indicating higher than average concentration. Each of these occupations also has at least one top-five social distancing ranking. Northeast Minnesota, as a result, will likely have to work harder than other parts of the state to manage the continuing social distancing requirements, particularly within hard-hit occupations and industries such as healthcare, construction, and food preparation & serving.
Interestingly, food preparation & serving and healthcare practitioners & technical occupations had the same average social distancing scores and employment concentration, yet the latter has fared relatively better with a smaller share of UI claims. One of the factors that is not accounted for in this social distancing rules analysis is the essential work distinction. Within many occupational groups, there are jobs in industries that were considered non-essential. During the Stay at Home order, employees in non-essential industries were more likely to be laid off than those deemed essential. A much larger portion of health care jobs were labeled essential and therefore provided a measure of protection that did not extend to most food prep and serving occupations.
The recovery process will be a long one for all types of work. However, those jobs less easily conducted from home as well as those necessitating close physical proximity will face additional challenges. These challenges will require creativity and resourcefulness on the part of all parties in order to get employees and businesses back to work.
Contact Northeast Minnesota Labor Market Analyst Carson Gorecki at 218-302-8413.