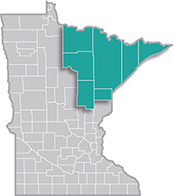
 Home to the state's second-largest metro, the Northeast Region has a strong industrial sector, tied largely to the area's abundant natural resources.
Most of the manufacturing base centers on mining and forest products industries. More than half of the sector's employment is in paper and machinery manufacturing.
Want the freshest data delivered by email? Subscribe to our regional newsletters.
9/18/2024 2:40:32 PM
Carson Gorecki
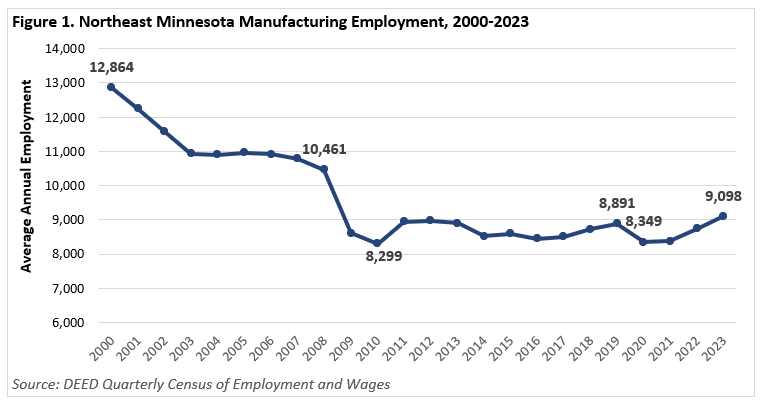
"Manufacturing employment is growing in Northeast Minnesota." This is a statement that has not been uttered often over the last couple decades. However, after a decade of significant decline, followed by a decade of stagnation, employment has now grown three consecutive years, building upon the modest growth that was perforated by the Pandemic Recession. As a result, Manufacturing employment is the highest it has been since before the Great Recession (see Figure 1).
This growth has come with some changes. As some older stalwarts of the sector like Paper Manufacturing have declined, other newer subsectors like Transportation Equipment and Beverage Manufacturing have expanded significantly. With nearly 9,100 jobs at 332 establishments, the Manufacturing sector accounted for 6.6% of total employment in the region, making it the sixth largest sector in 2023. Since 2019, the Manufacturing sector added 207 jobs (+2.3%) and was one of only four out of 20 sectors to grow over the four-year period. Over the last year, employment growth was even stronger as the sector added 366 jobs, expanding 4.1%, the fastest of all sectors.

In 2000, the Manufacturing sector was much larger. With nearly 12,900 jobs and 9.2% of employment, it was the fourth largest sector in Northeast Minnesota. Even further back in 1940, Manufacturing accounted for nearly one out of every six jobs in Duluth and about one out of every eight jobs statewide. In 2023, Northeast Minnesota has a smaller share of Manufacturing employment relative to the state. This is evident in a Manufacturing location quotient of less than one. The long trend of Manufacturing employment decline in the region has made the recent resurgence more notable.
Transportation Equipment Manufacturing has been a driver of recent growth. The subsector is much more concentrated than other Manufacturing subsectors in the region and continues to add to its strength. However, the most concentrated Manufacturing subsector is and has been Paper Manufacturing, which still has about four times the state's average employment share, despite losing 745 jobs over the last decade. Also with above-average concentration are Apparel Manufacturing (3.0), Transportation Equipment Manufacturing (2.4), Textile Product Mills (2.0), Beverage Manufacturing (1.3), Primary Metal Manufacturing (1.2) and Nonmetallic Mineral Product Manufacturing (1.1).
Looking in more detail, the diverging fortunes of the sector become clearer. Subsectors like Transportation Equipment Manufacturing and Primary Metal Manufacturing, Miscellaneous Manufacturing and Beverage Manufacturing added jobs over the pandemic period (2019-2023). Others, such as Apparel Manufacturing, Printing & Related Support Activities and Plastic & Rubber Products Manufacturing saw sizeable percent declines (see Table 1).
Transportation Equipment Manufacturing added almost 350 jobs in the last two years alone. The next largest positive numeric addition was 139 jobs in Computer and Electronic Product Manufacturing. Over the last decade, Transportation Equipment Manufacturing employment more than tripled and Miscellaneous Manufacturing employment nearly doubled. Machinery Manufacturing, the second largest subsector also saw strong growth over the decade, adding over 300 jobs.
Meanwhile Paper Manufacturing, the largest Manufacturing subsector in the region, has seen long-term declines. The modest gains seen in 2022 and 2023 represent the only time growth occurred in consecutive years since at least as far back as 2000. From 2013 to 2023, Paper Manufacturing employment declined by 745 jobs, or 32%. The only subsectors with larger percent losses over the decade were Chemical Manufacturing (-43%), Primary Metal Manufacturing (-39%) and Apparel Manufacturing (-37%), but they had many fewer jobs comparatively.
| Table 1. Manufacturing Employment and Wage Statistics in Northeast Minnesota | ||||||||
|---|---|---|---|---|---|---|---|---|
| Industry Title | 2023 Employment | 2019-2023 Employment Change | 2021-2023 Employment Change | 2013-2023 Employment Change | 2023 Wage | |||
| Total, All Industries | 138,508 | -5,175 | -3.6% | +4,048 | +3.0% | -1,813 | -1.3% | $56,108 |
| Manufacturing | 9,098 | +207 | +2.3% | +720 | +8.6% | +200 | +2.2% | $70,148 |
| Paper Manufacturing | 1,576 | -165 | -9.5% | +38 | +2.5% | -745 | -32.1% | $94,380 |
| Machinery Mfg. | 1,459 | -7 | -0.5% | +26 | +1.8% | +319 | +28.0% | $70,616 |
| Transportation Equipment Mfg. | 1,405 | +413 | +41.6% | +349 | +33.0% | +941 | +202.8% | $77,688 |
| Fabricated Metal Product Mfg. | 785 | +13 | +1.7% | -3 | -0.4% | -12 | -1.5% | $64,272 |
| Wood Product Mfg. | 599 | +17 | +2.9% | +31 | +5.5% | -104 | -14.8% | $66,872 |
| Nonmetallic Mineral Product Mfg. | 507 | -24 | -4.5% | +19 | +3.9% | n/a | n/a | $81,276 |
| Computer & Electronic Product Mfg. | 416 | -15 | -3.5% | +139 | +50.2% | -25 | -5.7% | $70,044 |
| Beverage & Tobacco Product Mfg. | 340 | +53 | +18.5% | +45 | +15.3% | n/a | n/a | $33,592 |
| Primary Metal Mfg. | 306 | +71 | +30.2% | +58 | +23.4% | -194 | -38.8% | $72,956 |
| Plastics & Rubber Products Mfg. | 276 | -77 | -21.8% | -85 | -23.5% | -88 | -24.2% | $51,584 |
| Food Mfg. | 267 | -31 | -10.4% | +4 | +1.5% | -46 | -14.7% | $50,232 |
| Miscellaneous Mfg. | 256 | +47 | +22.5% | +90 | +54.2% | +123 | +92.5% | $44,720 |
| Textile Product Mills | 217 | -17 | -7.3% | +13 | +6.4% | -21 | -8.8% | $38,324 |
| Chemical Mfg. | 179 | -31 | -14.8% | -15 | -7.7% | -133 | -42.6% | $78,416 |
| Printing & Related Support Activities | 165 | -53 | -24.3% | -28 | -14.5% | n/a | n/a | $40,092 |
| Furniture & Related Product Mfg. | 112 | +16 | +16.7% | +8 | +7.7% | n/a | n/a | $56,732 |
| Apparel Mfg. | 95 | -56 | -37.1% | -25 | -20.8% | -55 | -36.7% | $35,360 |
| Source: DEED Quarterly Census of Employment and Wages | ||||||||
Manufacturing wages, averaging $70,148 in 2023, grew 5.7% over two years and 2.4% over the last year. By comparison, total wages for all industries in the region rose 7.4% and 2.7%, respectively. The gap in wage growth narrowed into 2023. The Manufacturing subsectors with the largest wage growth over the past two years were Miscellaneous Manufacturing (+21.6%), Apparel Manufacturing (+18.9%) and Furniture & Related Product Manufacturing (+17.2%). Despite the strong growth, each of those subsectors still paid wages below the sector average in 2023.
While employment growth has not been experienced by all subsectors over recent years, it is heartening to see a traditional cornerstone sector begin to gather steam again in Northeast Minnesota. A great way to celebrate Manufacturing Month in Minnesota!
You can find a listing of career exploration and hiring events taking place throughout the month of October, in recognition of Manufacturing Month.
Contact Carson Gorecki at carson.gorecki@state.mn.us.