 The presence of such industry powerhouses as Polaris, Arctic Cat and New Flyer make Northwest Minnesota a hub of transportation equipment manufacturing.
From wheat and potatoes to soybeans and sugar beets, the region is a major producer and processor of food staples and specialty agricultural products.
Want the freshest data delivered by email? Subscribe to our regional newsletters.
3/26/2024 1:00:40 PM
Anthony Schaffhauser
DEED's most recent regional Local Area Unemployment Statistics (LAUS) reveal a slight uptick in the 2023 annual unemployment rate. Does this mark the end of our tight labor market? To answer this question, we need to understand the long-term demographic trends that underpin how Northwest Minnesota's labor market got so tight to begin with. Although it may seem so, our tight labor market did not begin with the pandemic recovery.
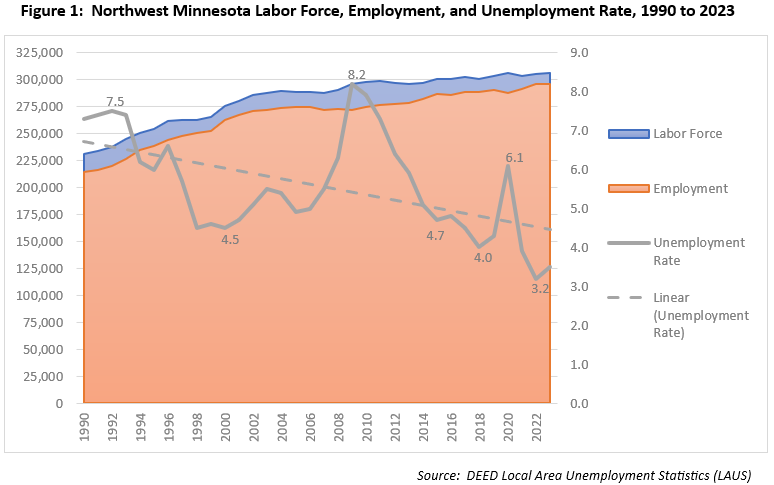
Figure 1 plots the labor force (blue line), which shows a clear slowdown in labor force growth starting around 2002. In fact, from 1990 to 2002 the labor force grew at a 1.8% annualized rate, then from 2002 to 2023 the labor force grew at a 0.3% annual rate – one-sixth the prior growth rate. Thus, our current tight labor market can be traced back to a trend that began more than two decades ago.

That trend is defined by Northwest's largest working-age cohort, the Baby Boomers, progressing through the so-called "prime working years" of age 25 to 54. It is considered prime working years because it has the highest labor force participation rate. For example, in 2000 the labor force participation of Northwest Minnesota's population aged 25 to 54 was 86.3%, compared to 68.5% for 16 to 24 year olds and 30.1% for people aged 55 years and over.1 Baby Boomers, born from 1946 to 1964, went from ages 26 to 44 in 1990 to ages 36 to 54 in 2000. Thus, our massive Baby Boomer cohort was in their prime working years for the entire 1990 to 2000 decade. After 2000, some Baby Boomers aged beyond their prime working years and had lower labor force participation. In 2000, people aged 55 to 59 had a 69.6% labor force participation, a significant drop from the 86.3% for prime working years.
At the same time, the population entering the 25 to 54 year old age group was smaller than the Baby Boomer population aging out. This is because Generation X was not nearly as large as the Baby Boomer generation and a significant share of the Baby Boomer's kids left the region before aging into their prime working years. There were 75,812 people aged 15 to 24 in 2000, but ten years later there were only 61,193 people aged 25 to 34 in 2010.
In contrast, more Baby Boomers were moving into Northwest Minnesota. There were 69,800 people aged 45 to 54 in 2000, compared to 73,434 people aged 55 to 64 in 2010. Despite growth, this demographic trend tightens the labor force as the Baby Boomers age because labor force participation drops progressively for people aged 65 years and older. What's more, while the Baby Boomers are participating less and less in the labor force, they are still adding to the demand for labor in the region, as they consume goods and services.
From that demographic trend alone, one would have expected the labor force to tighten significantly starting in 2011 when the Baby Boomers began turning age 65. From 2011 to 2015, the labor force participation rate for people aged 65 to 74 was 24%, much lower than the 68.8% for people aged 55 to 64.2
However, the Great Recession and its aftermath overwhelmed this demographic trend. Figure 1 shows Northwest's unemployment rate spiked to an all-time recorded annual high of 8.2% in 2009. Even with the Baby Boomers reaching the traditional retirement age of 65 during this time frame, the unemployment rate did not reach a new decade-plus low until 2015, when it descended to 4.7%. This is also when the number of unemployed workers was decreasing – note the shrinking blue shaded area around 2015, which is the difference between the labor force and the employed.
While the unemployment rate continued to drop to its pre-pandemic annual low of 4.0% in 2018, the labor force remained flat, with 300,940 workers in 2015 compared to 300,359 workers in 2018. With the recovery from the Great Recession complete, the pre-existing demographic trend had reasserted its restraint on labor force growth and resumed its tightening of the labor market.
This labor market tightening trend is measured by the decreasing unemployment rate. Figure 1 includes a best-fit linear trendline of the unemployment rate to illustrate this. The Pandemic Recession caused a brief countertrend increase in 2020, but the unemployment rate resumed its decreasing trend by 2021. The reassertion of declining unemployment – indicating a tightening labor market – after two recessions more than a decade apart (2009 and 2020) shows the relentless influence of demographics on the Northwest's labor market.
As the saying goes, "Demographics is destiny." We have five more years until the youngest Baby Boomers reach age 65, so we are predisposed to have a tight labor market at least until then. Still, barring some new shock I suspect we will be closer to a 4% state unemployment rate than a 3% unemployment rate in the coming couple of years as the economy finishes rebalancing from the substantial pandemic disruption. The Northwest Minnesota unemployment rate already ticked up from 3.2% in 2022 to 3.5% in 2023, and the U.S. unemployment rate had climbed to 3.9% in February 2024.
However, Northwest's unemployment rate trendline will continue down to sub-4% unless something breaks the demographic trend. One imaginable trend-breaker is if Generation Z, which includes people from 10 to 25 years of age, does not follow the same young adult out-migration pattern as the Millennials. Or, if there were a large net in-migration of working-age adults between 25 and 54 years of age. Another disruptor is rapid labor-saving advances from automation or artificial intelligence. I'll check in with a blog on LAUS annual data in a future year to let you know if the trend is broken.
Contact Anthony Schaffhauser at anthony.schaffhauser@state.mn.us.
1U.S. Census Bureau, 2000 Decennial Census, SF3, Table PCT035, accessed at www.data.census.gov on 3/10/2024.
2The 2015 American Community Survey 5-year estimates combines survey responses for the five years 2011 through 2015.