 The presence of such industry powerhouses as Polaris, Arctic Cat and New Flyer make Northwest Minnesota a hub of transportation equipment manufacturing.
From wheat and potatoes to soybeans and sugar beets, the region is a major producer and processor of food staples and specialty agricultural products.
Want the freshest data delivered by email? Subscribe to our regional newsletters.
9/18/2024 3:00:38 PM
Anthony Schaffhauser
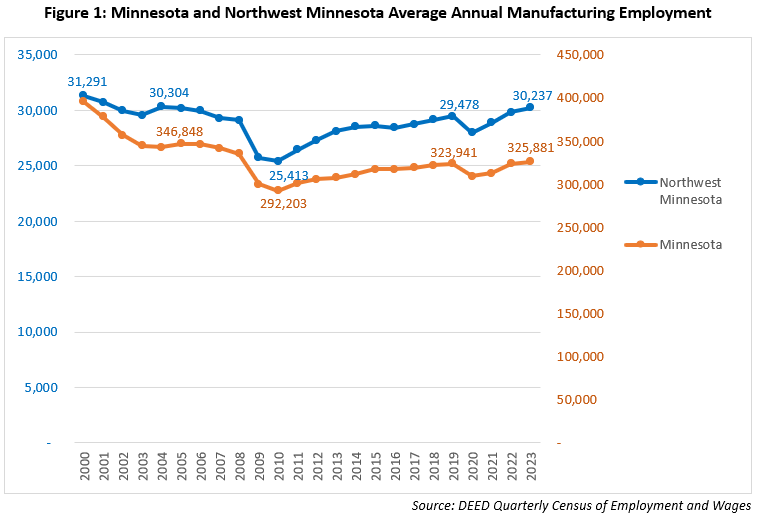
October is Manufacturing Month in Minnesota, so it is a fitting time to celebrate that annual average Manufacturing employment in Northwest Minnesota was higher in 2023 than at any time since 2004 (see Figure 1). What's more, 2023 marks the first time in the last three recession recoveries that Manufacturing employment has topped its pre-recession level. This is true both for Minnesota statewide and the Northwest region. Total employment in Minnesota and the Northwest exceeded 2019 levels in 2023. While Minnesota Manufacturing employment also exceeded 2019 levels in 2023, Northwest Minnesota manufacturing employment surpassed it's 2019 level one year earlier in 2022.

In contrast, Manufacturing employment did not spring back along with total employment after the prior two recessions. In 2013, total employment for all industries in Minnesota surpassed its prior 2007 peak, marking employment recovery from the Great Recession. However, Manufacturing employment in Minnesota has not fully returned to levels seen prior to the Great Recession.
Northwest Minnesota Manufacturing employment did not surpass its 2007 level until 2019, whereas Northwest total employment surpassed its prior peak of 2006 by 2014, a year later than Minnesota statewide. Neither Minnesota nor the Northwest have regained Manufacturing employment levels seen prior to the Dot-Com Recession of 2001. However, the Northwest is closer to the Manufacturing employment count at the turn of the century than Minnesota statewide. Manufacturing employment in the Northwest is within 3.4% of its 2000 level, whereas Minnesota Manufacturing employment is down 17.6% since 2000.
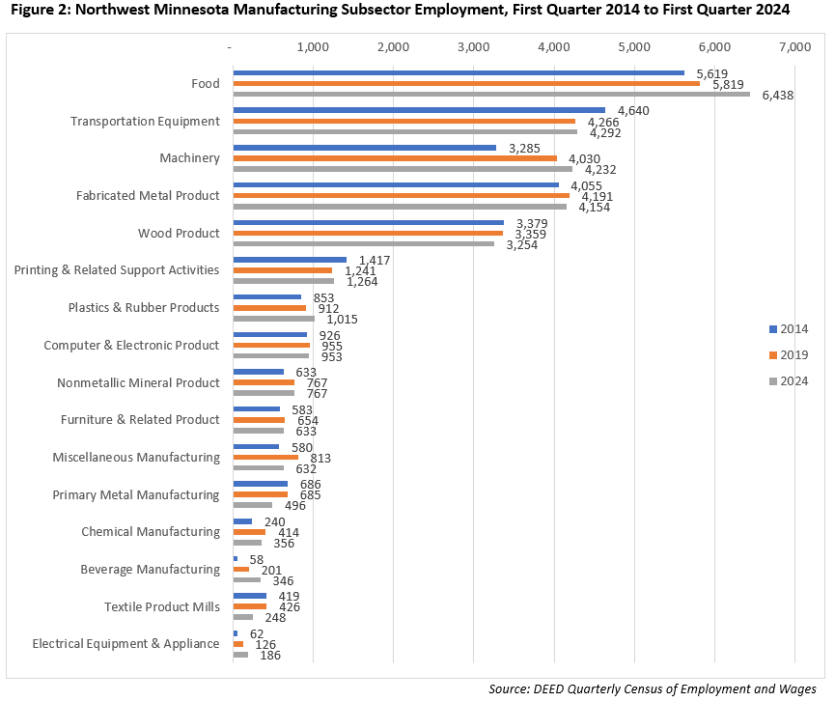
Much of the Manufacturing employment growth in the Northwest is attributable to the Food, Beverage and Machinery Manufacturing subsectors (Figure 2). Food Manufacturing is the largest manufacturing subsector in the Northwest, and it added 819 jobs, or 14.6%, from first quarter 2014 to first quarter 2024. (Note from here on I will drop "first quarter" when discussing the data in Figure 2, but keep in mind that all employment changes listed for 2024 or compared to a time period ending in 2024 refer to the first quarter. First quarter 2024 is the most recent Quarterly Census of Employment & Wages data available.)
Food Manufacturing grew much faster in the second half of the decade: It grew 3.6%, adding 200 jobs, in the five years from 2014 to 2019, while it grew 10.6%, adding 619 jobs, from 2019 to 2024. Looking to the future, according to DEED's Employment Outlook, Food Manufacturing employment is projected to add over 370 additional jobs from 2022 to 2032, or nearly 6% growth. Note that DEED's Employment Outlook is an annual average for 2022 to 2032, not first quarter as shown in Figure 2).

Machinery Manufacturing is the third largest manufacturing subsector, and it added the largest number of jobs over the decade from 2014 to 2024. However, Machinery Manufacturing had a much stronger surge from 2014 to 2019, adding 745 jobs or 22.7% growth, than from 2019 to 2024, when it added 202 jobs for 5% growth. While Machinery Manufacturing growth slowed significantly over the latest five years, note that it is projected to grow 8.2% over the decade from 2022 to 2032, according to DEED's Employment Outlook. This growth is very important to the regional prosperity because Machinery Manufacturing has the second highest average annual wages of the Northwest Minnesota Manufacturing subsectors at $75,712, compared to $64,948 for the entire Manufacturing sector and $51,376 for Total, All Industries. Chemical Manufacturing pays the highest of these subsectors at $89,960.
Beverage Manufacturing is the Northwest's third smallest Manufacturing subsector, but it added the third largest number of jobs from 2014 to 2024. Employment increased nearly five-fold with 288 additional jobs. These jobs were gained evenly between the first and second half of the decade: 143 jobs were added from 2014 to 2019, and 145 were added from 2019 to 2024. Craft brewing and distilling has had a strong growth trend in Northwest Minnesota, as well as statewide and nationwide. The number of Breweries in Northwest Minnesota increased from four in 2014 to 16 in 2023, according to DEED's Quarterly Census of Employment & Wages. The number of craft breweries reached an all-time high of 237 in Minnesota and an all-time high of 9,683 in the U. S. in 2023. Northwest Minnesota's Beverage Manufacturing subsector employment is expected to moderate from 2022 to 2032 according to DEED's Employment Outlook, but still have brisk growth of nearly 21%, adding about 70 additional jobs.
Plastics & Rubber Products Manufacturing ranks near the middle of the Northwest's Manufacturing subsectors by employment size; however, it is fourth in terms of the number of jobs added, increasing by 162 jobs, or 19%, from 2014 to 2024. Most of this growth happened in the second half of the decade, with an additional 103 jobs, or 11.3% growth, from 2019 to 2024. Growth from 2022 to 2032 is projected to be a slower 6.5%, with 69 additional jobs.
Although Electrical Equipment & Appliance Manufacturing is Northwest Minnesota's smallest subsector, it is worth noting that employment tripled from 2014 to 2024, with 124 additional jobs gained. The job additions were split close to evenly between the first and second halves of this decade. Prospects look good for this subsector to beat the projected 10 additional jobs from 2022 to 2032 because 16 jobs were added already between first quarter 2022 and first quarter 2024.
Besides Beverage Manufacturing and Electrical Equipment & Appliance Manufacturing, the seven smallest of the manufacturing subsectors in Figure 2 all had employment declines from 2019 to 2024. However, all of these are expected to grow employment from 2022 to 2032, except Textile Product Mills which is expected to have stable employment. Thus, these smaller subsectors are expected to add to manufacturing employment over the longer term.
Circling back to some of the largest of the Northwest's Manufacturing subsectors, Transportation Equipment Manufacturing is the second largest, and it is great to see employment stabilizing from 2019 to 2024 after a loss of 374 jobs from 2014 to 2019. This subsector only added 26 jobs from 2019 to 2024, but employment was declining from 2019 to 2022. If the region realizes the projected 165 additional jobs from 2022 to 2032, that would represent stable employment compared to 2024 levels.
Fabricated Metal Product Manufacturing is the fourth largest manufacturing subsector, and it experienced a slight employment decline from 2019 to 2024. However, if our projections are correct, we can expect a return to growth with a 4.1% increase, or 165 jobs to be added from 2022 to 2032.
Wood Product Manufacturing is fifth largest, and first quarter employment has bounced around between 3,100 jobs and 3,180 jobs over the decade from 2014 to 2024. Wood Product Manufacturing employment is projected to continue to be essentially trendless over the decade from 2022 to 2032, with just 48 jobs lost, or a -1.5% decline.
To round out the discussion of Figure 2, the three remaining subsectors of Printing, Computer & Electronic Product, and Nonmetallic Mineral Product Manufacturing each had stable employment from 2019 to 2024. While employment in Printing is projected to decline by 81 jobs, or 5.9% from 2022 to 2032, employment in Computer & Electronic Product Manufacturing is projected to increase by 81 jobs, or 8.4% from 2022 to 2032. Nonmetallic Mineral Product Manufacturing employment is expected to decrease slightly by 17 jobs, or -1.9% from 2022 to 2032.
Overall, the entire Manufacturing sector is projected to increase by 619 jobs, or 2.2% from 2022 to 2032. The projected employment declines in Nonmetallic Mineral Product and Wood Product Manufacturing are expected to be more than offset by gains in other Manufacturing subsectors. Thus, Manufacturing employment in Northwest Minnesota has not only surpassed its 2005 level, prior to the Great Recession (Figure 1), it is also expected to hold up through 2032.
This is great news because, as mentioned above, Manufacturing jobs pay well above average wages. This adds to the prosperity of the region not only for those who work in Manufacturing, but also because a portion of these wages are spent on other goods and services supplied by other industries in the region. All of this is certainly worth celebrating for Manufacturing Month 2024!
You can find a listing of career exploration and hiring events taking place throughout the month around the state.
Contact Anthony Schaffhauser at Anthony.schaffhauser@state.mn.us.