 Southeast Minnesota is a health care and agricultural powerhouse. The region is home to the renowned Mayo Clinic and some of the world's most recognized food companies and brands.
Advanced manufacturing is especially strong here, with machinery, chemicals, and electronics among the top products.
Want the freshest data delivered by email? Subscribe to our regional newsletters.
8/31/2016 2:23:55 PM
Bridges, dams, tunnels, transportation and wastewater treatment systems as well as public and private buildings – all are necessary for Southeast Minnesota to maintain its quality and productivity. None of these would be possible without the architects and engineers in the region.
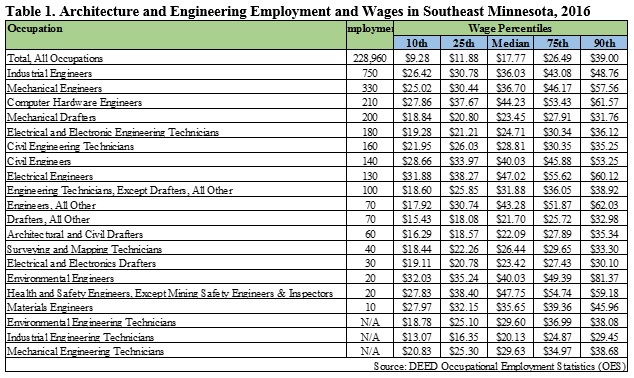
Architecture and engineering occupations make up only 1.4 percent of the total employment in the Southeast Economic Development Region. The largest occupations are industrial engineers (750), mechanical engineers (330), computer hardware engineers (210) and mechanical drafters (200). While these occupations may not dominate employment numbers in the region, they do offer higher wages, with median wages ranging from 22.1 percent to 168.7 percent higher than the $17.77 median wage across all occupations (see Table 1).

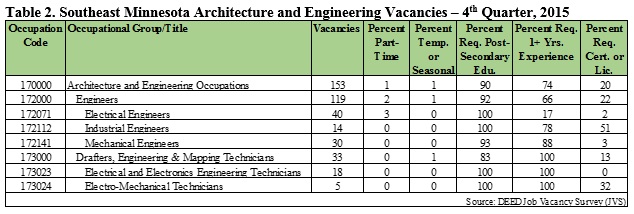
According to DEED’s most recent Job Vacancy Survey, there are currently about 150 vacancies in architecture and engineering in the region, with 119 openings for engineers and another 33 openings for drafters and for engineering and mapping technicians. Because the numbers are relatively small, vacancy data is limited, but some vacancy data for specific occupations within these occupational groups can be seen in Table 2.

Unlike some occupations, a high percentage of architecture and engineering jobs require post-secondary education as well as one or more years of experience. A very low percentage are part-time, temporary or seasonal. Wage offers for these architecture and engineering vacancies range from $18.23 to $30.52. Taken together, these are good indicators of high-quality jobs.
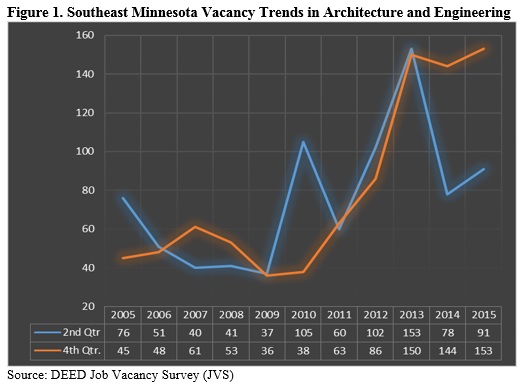
Over the years, the number of vacancies in architecture and engineering have seen fluctuations. As shown in Figure 1, since 2005, vacancies in this occupational group have ranged from a low of 36 in the fourth quarter of 2009 to a high of 153 in the second quarter of 2013 and the fourth quarter of 2015. While the number of vacancies saw a decline from 2005 to 2009, vacancies began to rise quickly coming out of the recession, which indicates demand for architecture and engineering services is growing.

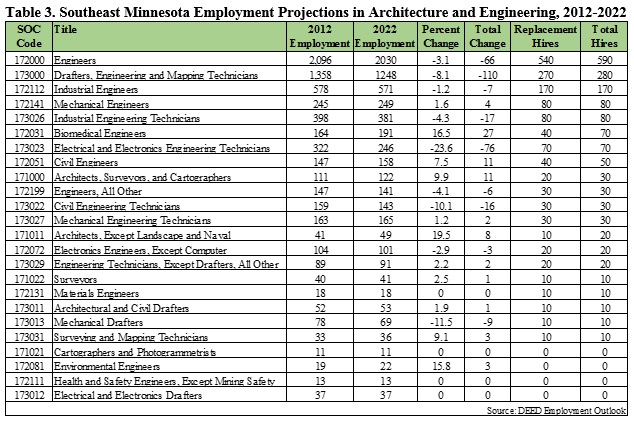
However, not all occupations in architecture and engineering are projected to see future growth. As seen in Table 3, many of the occupations in the industry are actually projected to see negative or no growth, and the number of total openings is, in large part, a reflection of the need for replacement hires to fill the void from individuals leaving these occupations, rather than new jobs being created.

Leading the pack for projected new openings are biomedical engineers, however the number of projected new openings is a modest 30 for this occupation. The data on the broader occupational groups based on the Standard Occupational Classification system shows that there is projected to be 590 total hires for engineers (17-2000), 280 for drafters, engineering technicians and mapping technicians (17-3000), and 30 for architects, surveyors and cartographers (17-1000). Again, much of this is due to the need for replacement hires rather than the result of new jobs.
Over the decade of this projection period, architecture and engineering has the third smallest amount of projected hiring demand – ahead of only farming and legal occupations – and are projected to account for just 1.1 percent of the total openings in the Southeast region.
Graduates with degrees in architecture and engineering are seeing higher median wages after graduation than the median wages across all post-secondary programs. While median wages are only 0.5 percent higher for workers graduating from architecture and related services programs one year after graduation, the median wages for engineering graduates were 56.7 percent higher and 13.3 percent higher for engineering technologies. This trend only increases in the second year after graduation (see Table 4).

Those who graduate from programs in architecture and related services tend to get jobs in professional and technical services. Meanwhile, manufacturing is the top industry for employment among those who graduate from engineering and engineering technologies programs. Although architecture and engineering occupations may not make up a dominant portion of total employment, current demand and projected openings show that these are definitely important jobs for the region.
Contact Mark Schultz.