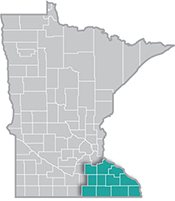
 Southeast Minnesota is a health care and agricultural powerhouse. The region is home to the renowned Mayo Clinic and some of the world's most recognized food companies and brands.
Advanced manufacturing is especially strong here, with machinery, chemicals, and electronics among the top products.
Want the freshest data delivered by email? Subscribe to our regional newsletters.
5/8/2018 9:47:04 AM
With the current jobseeker-per-vacancy ratio for Southeast Minnesota resting at 0.6 to 1 – meaning for every ten job vacancies there are only six unemployed individuals in the region – it is common to hear from many employers that they are frustrated with the struggle they are facing in finding employees to fill their openings. One strategy that some of these employers are utilizing to try and attract new talent to their workforce is by increasing wages – a logical response to this workforce dilemma.
DEED's Occupational Employment Statistics (OES) tool is the best source for wage data at the occupational level, built from survey responses from employers across the state and region. DEED recently released new wage data for the first quarter of 2018, which show the 10th through the 90th percentile hourly and annual wages for about 800 detailed occupations. This was an annual update, with the previous data published in the first quarter of 2017.
Because it draws employment and wage data from establishments over a series of survey periods covering three years, OES isn't meant to be used as a time series and there are some difficulties in making comparisons across short time periods. The use of six data panels to create the estimates means that sudden changes in employment or wages instead tend to show up gradually since the methodology assumes that industry staffing patterns change slowly and that detailed occupational wage rates in an area change at the same rate as the national change in the ECI wage component for the occupational group. Despite that, year-over-year wage changes can still be illustrative of general economic trends, and can show how wages are increasing in a region over time.
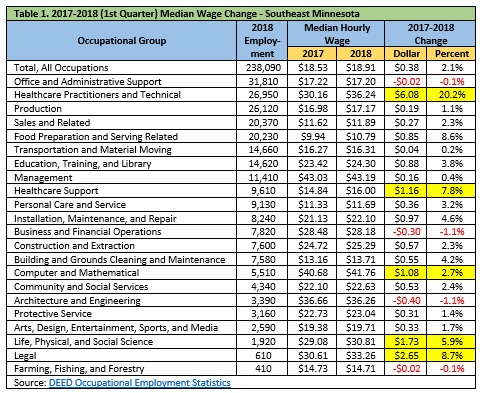
As shown in table 1, all but four occupational groups in Southeast Minnesota saw increases in median hourly wages from the first quarter of 2017 to the first quarter of 2018, with five groups seeing year-over-year raises of more than $1.00 per hour: computer and mathematical, healthcare support; life, physical and social science; legal, and healthcare practitioners and technical (which actually saw an increase of over $6.00 per hour). However, while one assumption might be that all occupational groups should have seen an increase in wages, there were four that actually saw a decline at the median, albeit rather small declines, including office and administrative support, farming, fishing and forestry, business and financial operations, and architecture and engineering, which saw decreases of $0.40 or less per hour at the median.

While it is promising to see that there have been so many increases in wages and that those that saw decreases experienced rather minimal declines, one question arises out of this: are the raises large enough to make up for the raise needed to meet cost of living needs?
As shown in table 2, the hourly wage needed for a typical family in Minnesota (two parents, one working full-time and one part-time, with one child) to meet a basic needs cost of living rose by 4.2 percent, or $0.65 per hour from 2017 to 2018. The most significant raises in particular cost categories were seen in transportation, taxes, child care, and health care. And while this $0.65 cents per hour increase in the hourly wage needed may seem somewhat small, 14 of the 22 occupational groups saw median wage increases that were less than that.

While the 2017-2018 wage data shows changes in the median levels, this should be read with a bit of caution. For example, the $6.08 rise in healthcare practitioners and technical occupational group does not mean that all individuals working in these occupations saw a raise of this amount. The main reason for the change was a huge shift in median wages for registered nurses, which is the largest occupation in the region. Median hourly wages for RNs increased from $30.02 in 207 to $36.87 in 2018, and with estimated employment of 9,570, they accounted for over one-third of total healthcare practitioners and technical occupations in Southeast Minnesota.
In addition, other median hourly wage changes could be the result of more individuals working in a higher-paying occupation, less working in lower-paying occupations, or a combination of both. While more detailed analysis could show more variation in the number of occupations seeing median wage increases or decreases and the magnitude of those changes, the data shows that in many cases, the wage increases that occurred in the last year were not equal to the wage increases required to meet the increase in basic cost of living needs.
In a tight labor market, one of the biggest implications would be that this could make it more difficult for employers to fill the vacancies they have for jobs that fail to pay enough to meet these cost of living requirements, which could subsequently affect their current productivity levels as well as the possibility that they can draw in additional business.
Contact Mark Schultz.