 Southeast Minnesota is a health care and agricultural powerhouse. The region is home to the renowned Mayo Clinic and some of the world's most recognized food companies and brands.
Advanced manufacturing is especially strong here, with machinery, chemicals, and electronics among the top products.
Want the freshest data delivered by email? Subscribe to our regional newsletters.
6/1/2018 9:47:04 AM
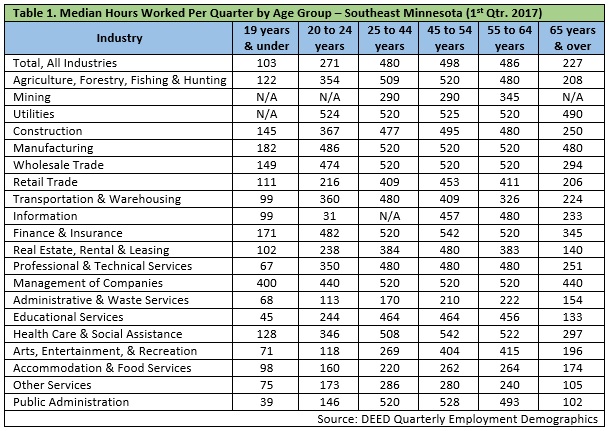
Forty hours per week is considered full-time employment, which equals 2,080 hours over the course of a 52-week year. Broken down by quarter, full-time employment equals 520 hours. DEED’s new Quarterly Employment Demographics (QED) tool provides data on the median number of hours worked by industry, which allows for a couple questions: How many hours are workers in Southeast Minnesota actually working? Which age groups are working the most and the least?
According to QED data, there was a wide range of median hours worked depending on the industry employees were working in as well as well as their age. For example, the median number of hours worked (50 percent of workers worked more hours, 50 percent worked less) by people aged 19 years and under in public administration was 39 hours in the first quarter of 2017, while those aged 45 to 54 years worked just over 540 hours per quarter in the finance and insurance and health care and social assistance sectors (Table 1).

Certain industry sectors are characterized by more part-time work; thus, there are fewer hours worked per quarter regardless of age. For example, the highest median number of hours worked per quarter by age group in accommodation and food services was 264 hours, while in administrative support and waste management services median hours topped out at 222.
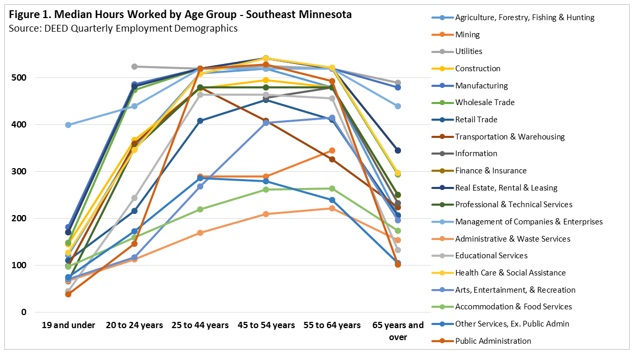
There is a general pattern in the median number of hours worked by age and industry sector. Younger workers tend to work the least number of hours, with median hours increasing in each older age group before typically peaking between the ages of 45 to 64, then tapering off as individuals get older (Figure 1).

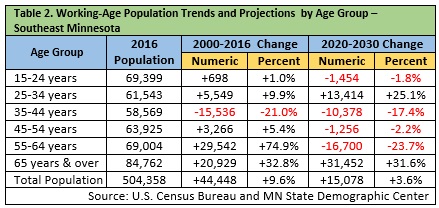
Since 2000, the working-age population has seen a general increase despite a decrease in those between the ages of 35 to 44 years. The region is also projected to see an overall increase in the working-age population from 2020 to 2030. However, a large portion of that increase is a result of the population aged 65 years and over, due to the population getting older and baby boomers moving into higher age brackets. Furthermore, the largest projected decrease in the population is anticipated to be among those between 45 and 64 (Table 2).

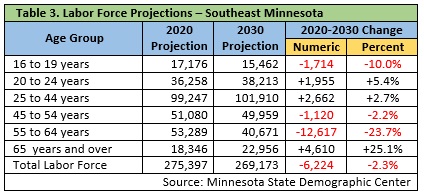
The impact of an aging population in the Southeast has become an important topic. Despite the projected population increase among working-age individuals, a decline of 6,224 members in the total labor force is predicted for 2020-2030 (Table 3). This projected loss is compounded by the fact that a bulk of the total labor force loss is anticipated among those between 45 to 64, who are typically working the most hours per quarter (Table 1).

In the future, employers in the region will struggle to get work hours covered. Although younger workers typically work less hours, a projected loss of over 1,700 in this age group could also have a negative impact on work coverage. And while there is an increase projected in the labor force for those 65 years and over, this segment of workers may likely be short-timers as they prepare for retirement.
However, other possible outcomes to these projected trends aren’t so bleak. Students just out of high school (if post-secondary education is not in the immediate future) and those at retirement age may pick up more hours. This may open up opportunities for those who face barriers to employment – such as criminal backgrounds, less-than-stellar work history, or no high school diploma or GED - to gain employment that allows them to work more.
Contact Mark Schultz.