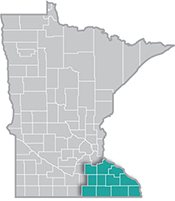
 Southeast Minnesota is a health care and agricultural powerhouse. The region is home to the renowned Mayo Clinic and some of the world's most recognized food companies and brands.
Advanced manufacturing is especially strong here, with machinery, chemicals, and electronics among the top products.
Want the freshest data delivered by email? Subscribe to our regional newsletters.
9/9/2020 9:00:00 AM
Occupational demand data is an important workforce development tool in Southeast Minnesota and the rest of Minnesota. This data can be used by job seekers to help narrow their job search and plan for their first career or help them move into a new one. When viewed in light of educational attainment data by race, this occupational demand data can also reveal the potential for widespread economic disparities by racial group, based on educational attainment.
| Table 1. Southeast Minnesota Occupations in Demand and Annual Wages by Education Level (Median Annual Wage) | |||
|---|---|---|---|
| Less than High School | High School or Equiv. | Some College or Associate's Degree | Bachelor's Degree or Higher |
| Personal Care Aides ($25,816) | Heavy & Tractor Trailer Truck Drivers ($45,900) | Registered Nurses ($76,167) | Elementary School Teachers ($58,908) |
| Combined Food Prep. & Serving Workers ($24,073) | Supervisors of Retail Sales Workers ($41,483) | Nursing Assistants ($33,876) | Secondary School Teachers ($65,057) |
| Retail Salespersons ($26,360) | Welders ($41,181) | Machinists ($45,810) | Software Developers, Systems ($95,225) |
| Cashiers ($25,349) | Teacher Assistants ($32,094) | Licensed Practical Nurses ($48,401) | Industrial Engineers ($81,973) |
| Stock Clerks & Order Fillers ($28,256) | Supervisors of Food Prep. & Serving Workers ($36,710) | EMT's & Paramedics ($38,092) | Middle School Teachers ($56,400) |
| Janitors and Cleaners ($30,833) | Office Clerks, General ($35,088) | Industrial Machinery Mechanics ($53,107) | Software Developers, Applications ($92,109) |
| Home Health Aides ($28,662) | Secretaries & Admin. Assistants ($36,994) | Surgical Technologists ($59,643) | Nurse Practitioners ($124,871) |
| Waiters & Waitresses ($24,154) | Shipping, Receiving & Traffic Clerks ($36,319) | Hairdressers, Hairstylists, & Cosmetologists ($26,439) | Computer & Info. Systems Managers ($119,561) |
| Laborers & Freight, Stock & Material Movers ($34,327) | Maintenance & Repair Workers, General ($43,941) | Radiologic Technologists ($75,534) | Accountants & Auditors ($63,630) |
| Cooks, Restaurant ($27,885) | Sales Reps. - Wholesale & Mfg. ($59,850) | Police & Sheriff's Patrol Officers ($66,334) | Human Resources Specialists ($57,923) |
| Source: DEED Occupations in Demand | |||
DEED's Occupations in Demand data shows the relative level of demand that exists for jobs in the region. This list can be sorted by educational level required to obtain employment in these occupations. For example, people with a high school diploma can narrow their job search to careers that require a high school diploma or equivalent, as can those with some college or an Associate's degree and those with a Bachelor's degree or higher. This data also provides median wages for these occupations, which may help individuals decide if taking a job in a certain occupation is a viable option financially.
When looking at the education and wage breakdown, the data shows that much of the time earning higher educational credentials leads to higher earnings. For example, among the top 10 in-demand occupations that require less than a high school diploma, median wages range from just over $24,000 for waiters and waitresses to $34,327 for laborers and freight, stock and material movers. In comparison, the wages for those with some college or an Associate's degree range from $26,439 for hairdressers, hairstylists and cosmetologists to over $76,000 for registered nurses. However, higher education does not always equate to higher earnings. For example, radiologic technologists with an Associate's degree earn higher median wages than do elementary and secondary school teachers with a Bachelor's degree. See Table 1.
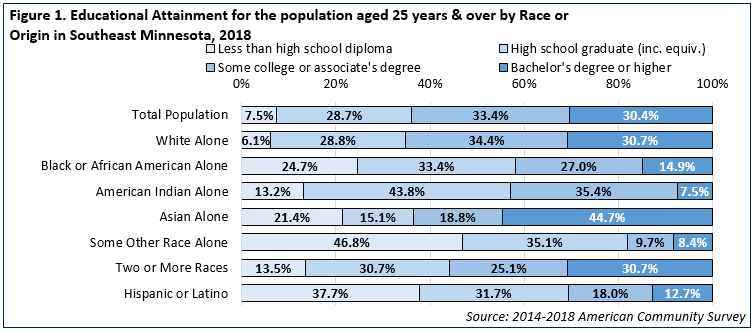
Upon looking at regional educational attainment data by race, we can see that certain race and ethnic groups have higher concentrations of people with less than a high school diploma. For example, among Black or African American residents in the region, 24.7% have less than a high school diploma, for those identifying as Hispanic or Latino that percentage is 37.7% and for those who identify as Some Other Race, almost half are at this education level. Comparatively, only 6.1% of the White population in the region have this lowest level of educational attainment. In addition, only 8.4% of those identifying as Some Other Race and 7.5% of American Indians have a Bachelor's Degree or higher, compared to 30.7% of their White counterparts. See Figure 1.

In light of this, we can see how certain racial and ethnic groups that are more highly represented by having lower educational attainment may only be able to obtain employment in those occupations that require this level of education. And while some of these occupations may be in-demand, as shown in Table 1, the earnings potential exhibited by median wages for the occupations that require this low level of educational attainment can yield income disparities based on race and ethnicity.
Lower levels of educational attainment in certain racial and ethnic groups in Southeast Minnesota, can lead to income disparities. A person's ability to obtain employment in an in-demand and higher-paying occupation may be stifled based on fewer educational opportunities and subsequent lower educational attainment. The key question we as a region should be asking ourselves is "what can be done to alleviate these racial and ethnic inequities?"
Contact Mark Schultz.