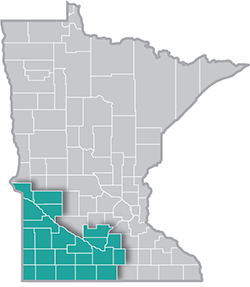
 Southwest Minnesota is a national leader in agricultural production, and renewable energy.
The region's thriving manufacturing sector includes food processing, machinery, printing, metal products, and computers and electronic products.
Want the freshest data delivered by email? Subscribe to our regional newsletters.
6/17/2024 2:50:36 PM
Luke Greiner, Amanda O'Connell
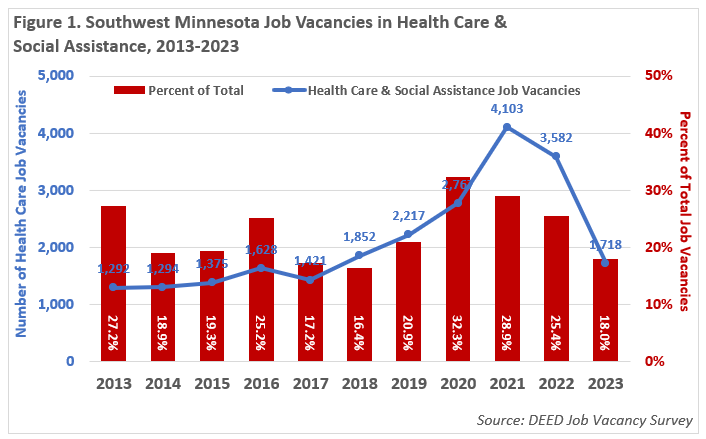
Following record-setting vacancy levels in 2021 and 2022, the number of openings in Health Care & Social Assistance returned to pre-pandemic levels according to the newly released 2023 Job Vacancy Survey. Health Care employers reported just over 1,700 job openings in 2023, including almost 750 postings for Healthcare Practitioners & Technical occupations and just over 500 openings for Healthcare Support occupations.
Health Care & Social Assistance typically accounts for the largest number of vacancies of any industry, ranging between 16% and 32% - or as much as one in every three but never less than one in every six openings. This clearly shows the outsized influence of Health Care & Social Assistance on hiring activity in the region (see Figure 1).

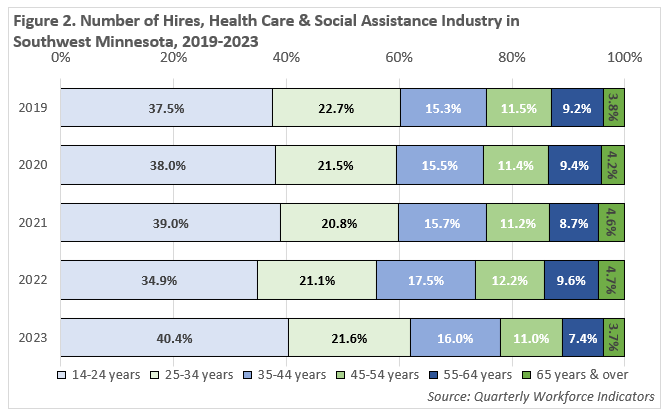
Data from the Quarterly Workforce Indicators program shows where the hiring activity has occurred in Health Care & Social Assistance. After a brief slowdown due to pandemic-related issues, the number of new hires rebounded in 2022 and reached historic highs in 2023, with a high reliance on teenagers and young adults (see Table 1 and Figure 2). These young workers are vital to industry growth.
Table 1. Number of Hires by Age Group in the Health Care & Social Assistance Industry in Southwest Minnesota, 2019-2023 |
|||||||||
|---|---|---|---|---|---|---|---|---|---|
| - | 14-18 years | 19-21 years | 22-24 years | 25-34 years | 35-44 years | 45-54 years | 55-64 years | 65 years & over | Total Hires |
| 2019 | 386 | 654 | 490 | 928 | 625 | 468 | 376 | 157 | 4,084 |
| 2020 | 386 | 676 | 460 | 859 | 620 | 458 | 376 | 169 | 4,004 |
| 2021 | 412 | 628 | 421 | 780 | 588 | 419 | 326 | 174 | 3,748 |
| 2022 | 444 | 684 | 473 | 966 | 799 | 559 | 439 | 214 | 4,578 |
| 2023 | 549 | 842 | 587 | 1,059 | 784 | 539 | 361 | 182 | 4,903 |
| Source: Quarterly Workforce Indicators | |||||||||

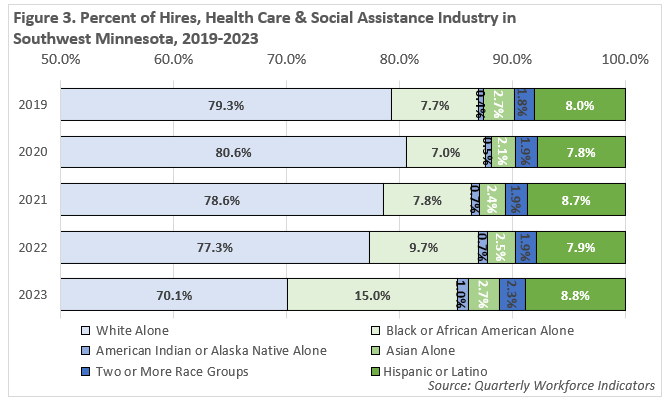
Health Care employers in the region have also shifted their hiring practices by race and ethnicity, with huge gains in the number and percent of hires in workers other than white alone. The number of jobholders who reported being white alone, not Hispanic increased 6.1% from 2019 to 2023, the equivalent of around 200 new hires. In comparison, the number of job holders who reported being Black or African American more than doubled (+133.3%), an increase of 420 hires. Hires for American Indians jumped 166.7%, up 30 hires; while hires of workers of Two or More Races increased 58.3% (+42 hires), Hispanic or Latino climbed 32% (+105 hires), and Asian rose 18.8% (+21 hires) (see Figure 3).

For more information on hiring activity in the Health Care & Social Assistance industry in Southwest Minnesota, contact Luke Greiner at luke.greiner@state.mn.us or Amanda O'Connell at amanda.oconnell@state.mn.us.