1/22/2021 9:30:09 AM
Labor Market Information Research Analyst Mustapha Hammida
DEED’s Labor Market Information (LMI) office provides research to inform the public about the economic and labor market conditions in our state and help guide potential responses to challenges. During COVID-19, LMI analysts – including my colleagues and myself – have found new ways to examine data to help understand fast-changing conditions during the pandemic.
Recently, I analyzed monthly employment at each Minnesota establishment from the Q2 Quarterly Census of Employment and Wages (QCEW) microdata to get a glimpse into the initial impact on businesses by comparing Q2 data from 2020 with Q2 data from 2019. Building on this research with analysis of data from Q3 and Q4 of 2020 will provide a fuller picture of the true impact on business closures and employment impacts.
Here’s what we know based on the data available so far. In March-April of 2019, the state added 2,756 establishments as the number of opening establishments exceeded the number of closing establishments. However, in March-April of 2020, the state lost 8,637 establishments as the opposite occurred: more closing establishments than opening establishments.
This means that COVID-19 caused a net loss of 11,393 establishments in Minnesota during March-April 2020. Of those, 10,492 establishments closed in March-April 2020 due to COVID-19, according to our formula. It’s very important to note that many of those establishments may be only temporarily closed and could reopen – our analysis of Q3 and Q4 data when they’re available will help clarify this point.
In fact, out of the 10,492 establishment closures in March-April of 2020 only 3,792 were still closed as of June 2020 and were concentrated in:
Of course, businesses are dynamic with openings, closings, expansions and contractions happening regularly in any month, so that dynamism needed to be considered when considering the impact of COVID-19. See the table below for a simple look at how the COVID-19 impact on business establishment numbers is calculated based on the differences between a normal year (2019) and our unprecedented year in 2020.
| Year
|
Number of Establishments
|
|||||
| March - April
|
Job Creating Establishments
|
Job Destroying Establishments
|
Change in Establishments | |||
| Expanding Establishments | Opening Establishments | Contracting Establishments | Closing Establishments | |||
| 2020 | 37,649 | 8,767 | 64,927 | 17,404 | -8,637 | |
| 2019
|
51,106 | 9,668 | 43,862 | 6,912 | 2,756 | |
| COVID-impact | -13,457 | -901 | 21,065 | 10,492 | -11,393 | |
| 8% | 92% | 100% | ||||
To build this database, the QCEW establishment data for first and second quarters of 2020 are linked. Then, monthly employment dynamics for a given month are computed by comparing the employment level in the given month to the employment level in the previous month. Through this computation, five categories of establishments are identified:
To help isolate the impacts of COVID-19 on Minnesota business establishments, numbers of businesses in those five categories are then compared to the numbers of businesses in those same categories in the second quarter of 2019 – a statistical technique called difference-in-differences. Stable establishments aren’t included in the table above because stable establishments exhibited no change in employment and therefore couldn’t be used to measure expansion or contraction.
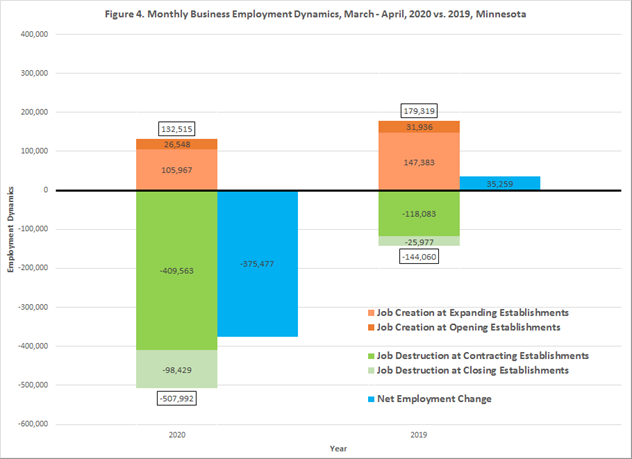
The bar graph below presents measures of the cumulative March to April monthly business employment dynamics for both 2019 and 2020 by looking at change in employment at opening, expanding, contracting and closing businesses and determining the net impact on employment, then comparing net impact in 2019 with 2020 to determine COVID-19's employment impact in March-April 2020.
You can see that while Minnesota businesses added 35,259 jobs from March to April 2019, they lost 375,477 jobs during the same period in 2020. Thus, the COVID-19 impact on net employment change in March-April 2020 is 410,736 jobs. Again, this is a snapshot in time at the lowest point of employment during the pandemic and many jobs lost were since regained.

Throughout the pandemic, DEED has been working to support small businesses as they do their part to combat the spread of COVID-19. That includes $72 million in small business support that Minnesota has allocated since the beginning of the pandemic. The state has also given nearly $840 million in support to local governments, much of which has been distributed to small businesses.
As of last week, the state has issued an additional $67.3 million in COVID-19 Business Relief Payments to the 3,891 eligible businesses. Additionally, DEED has relief application information for movie theaters and convention centers, as well as information for counties that will be distributing additional relief payments to businesses.
For a fuller picture of this data and what it means, see the article Assessing the Initial Impact of COVID-19 on Minnesota Employment and Business Establishments in the December issue of Minnesota Economic Trends, a quarterly publication of DEED’s Labor Market Information office.